Docs

Facebook Ads Insights Data Export

What is Facebook Ads Insights?

Facebook Ads is an online advertising platform developed by Facebook, where advertisers pay to display ads based on the keywords used in a user’s search query.

Facebook Ads report give you post-click performance metrics for users who clicked on your Facebook Ads and then came to your website, or installed and started using your mobile app.

How to add a Facebook Ads Source in Electrik.AI?

Follow these steps to connect your Facebook Ads account to Electrik.AI

Step 1: Ensure you have following prerequisites to create a Facebook Ads Connection in Electrik.AI

a. Facebook Ads Account User Id and Password.

b. Access to Facebook Ads.

Step 2: Sign-in into your Electrik.AI account

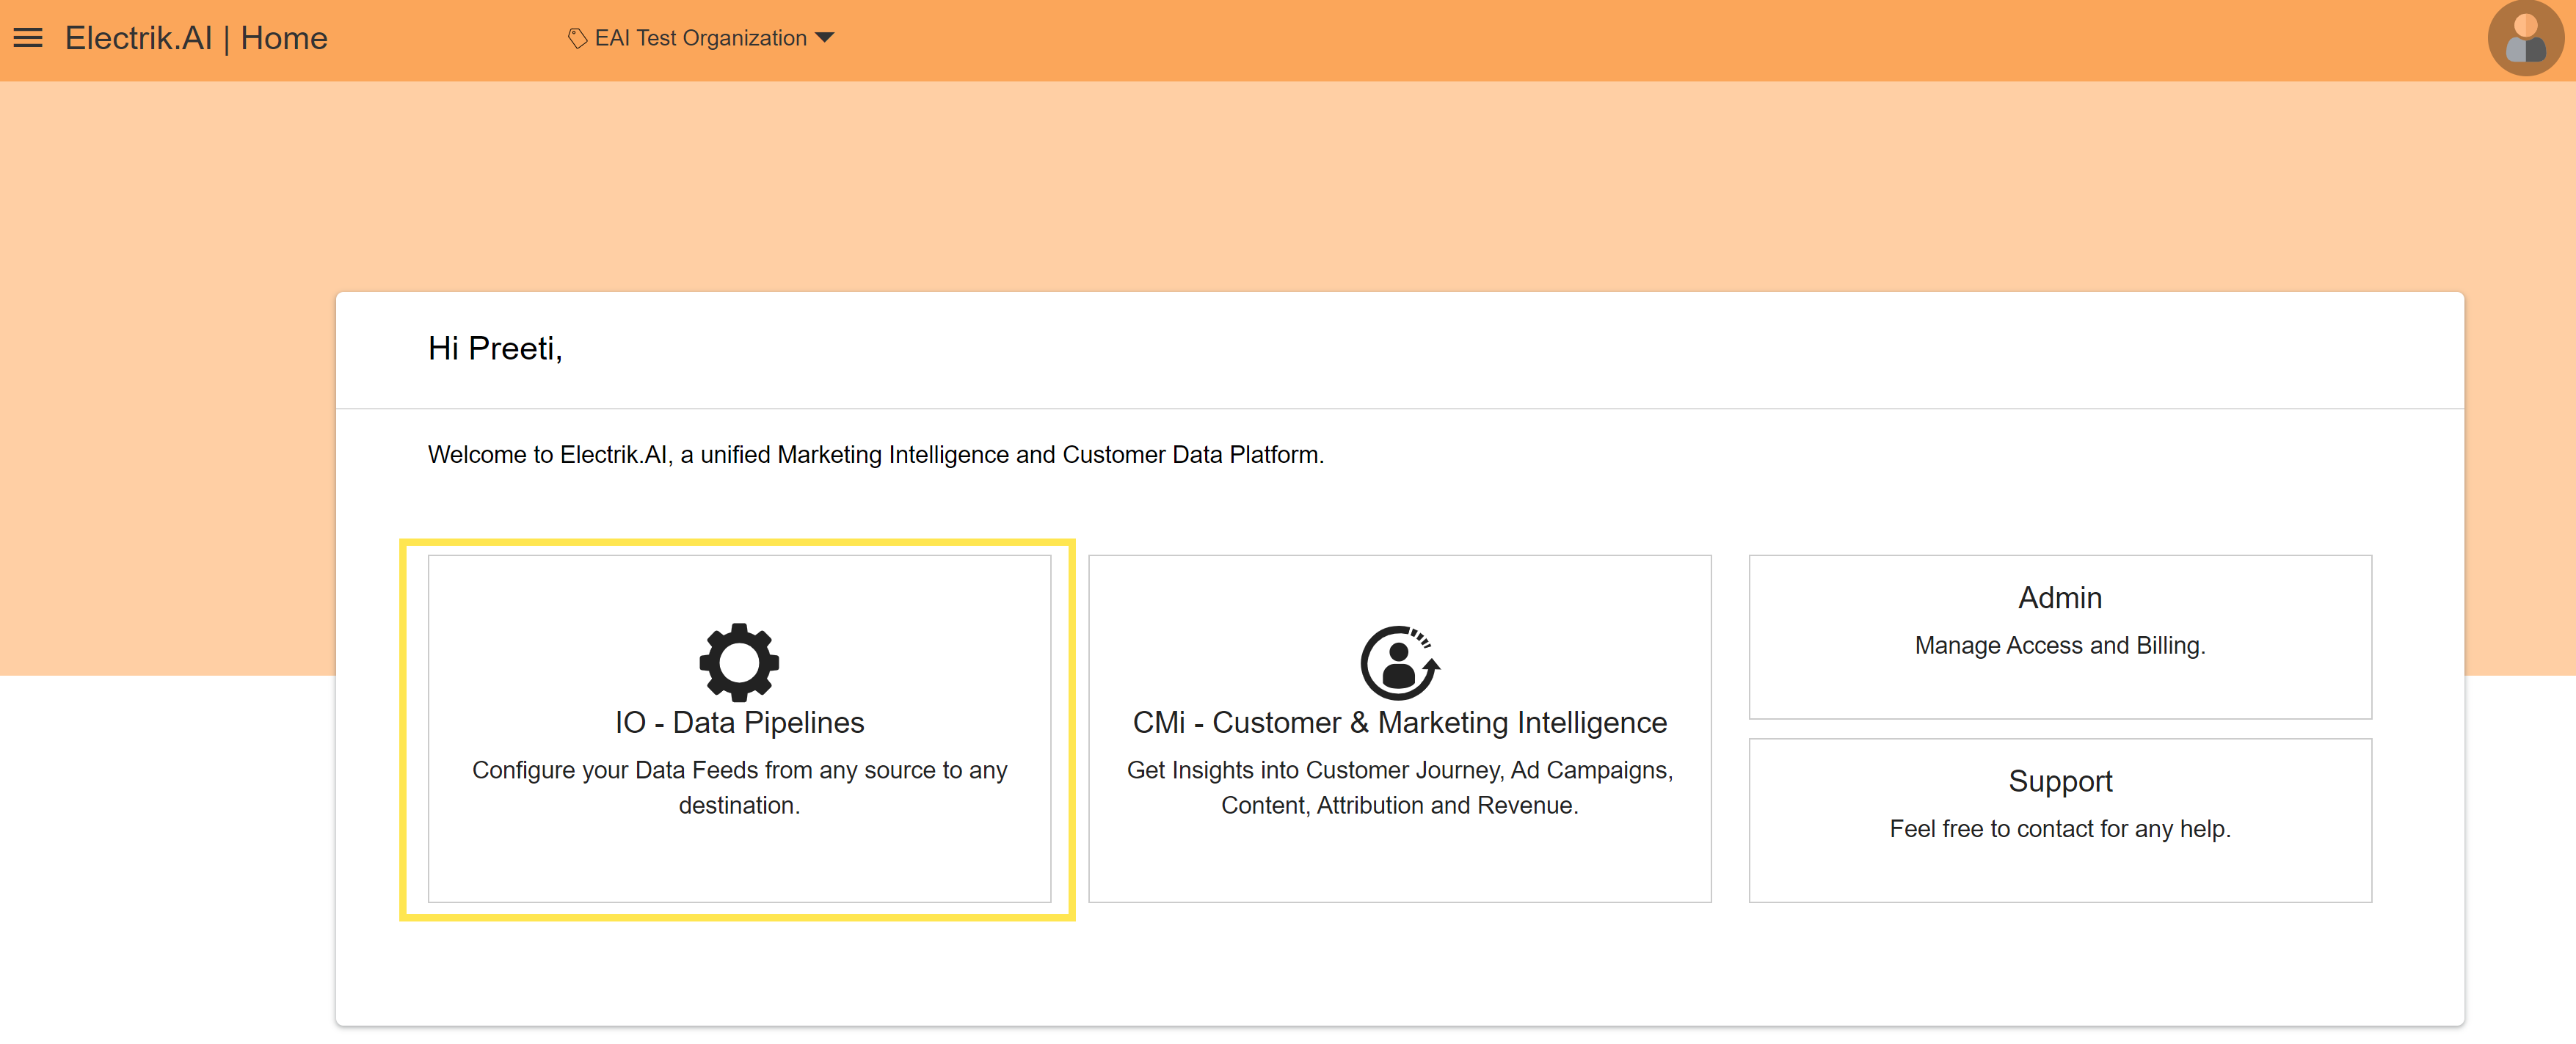
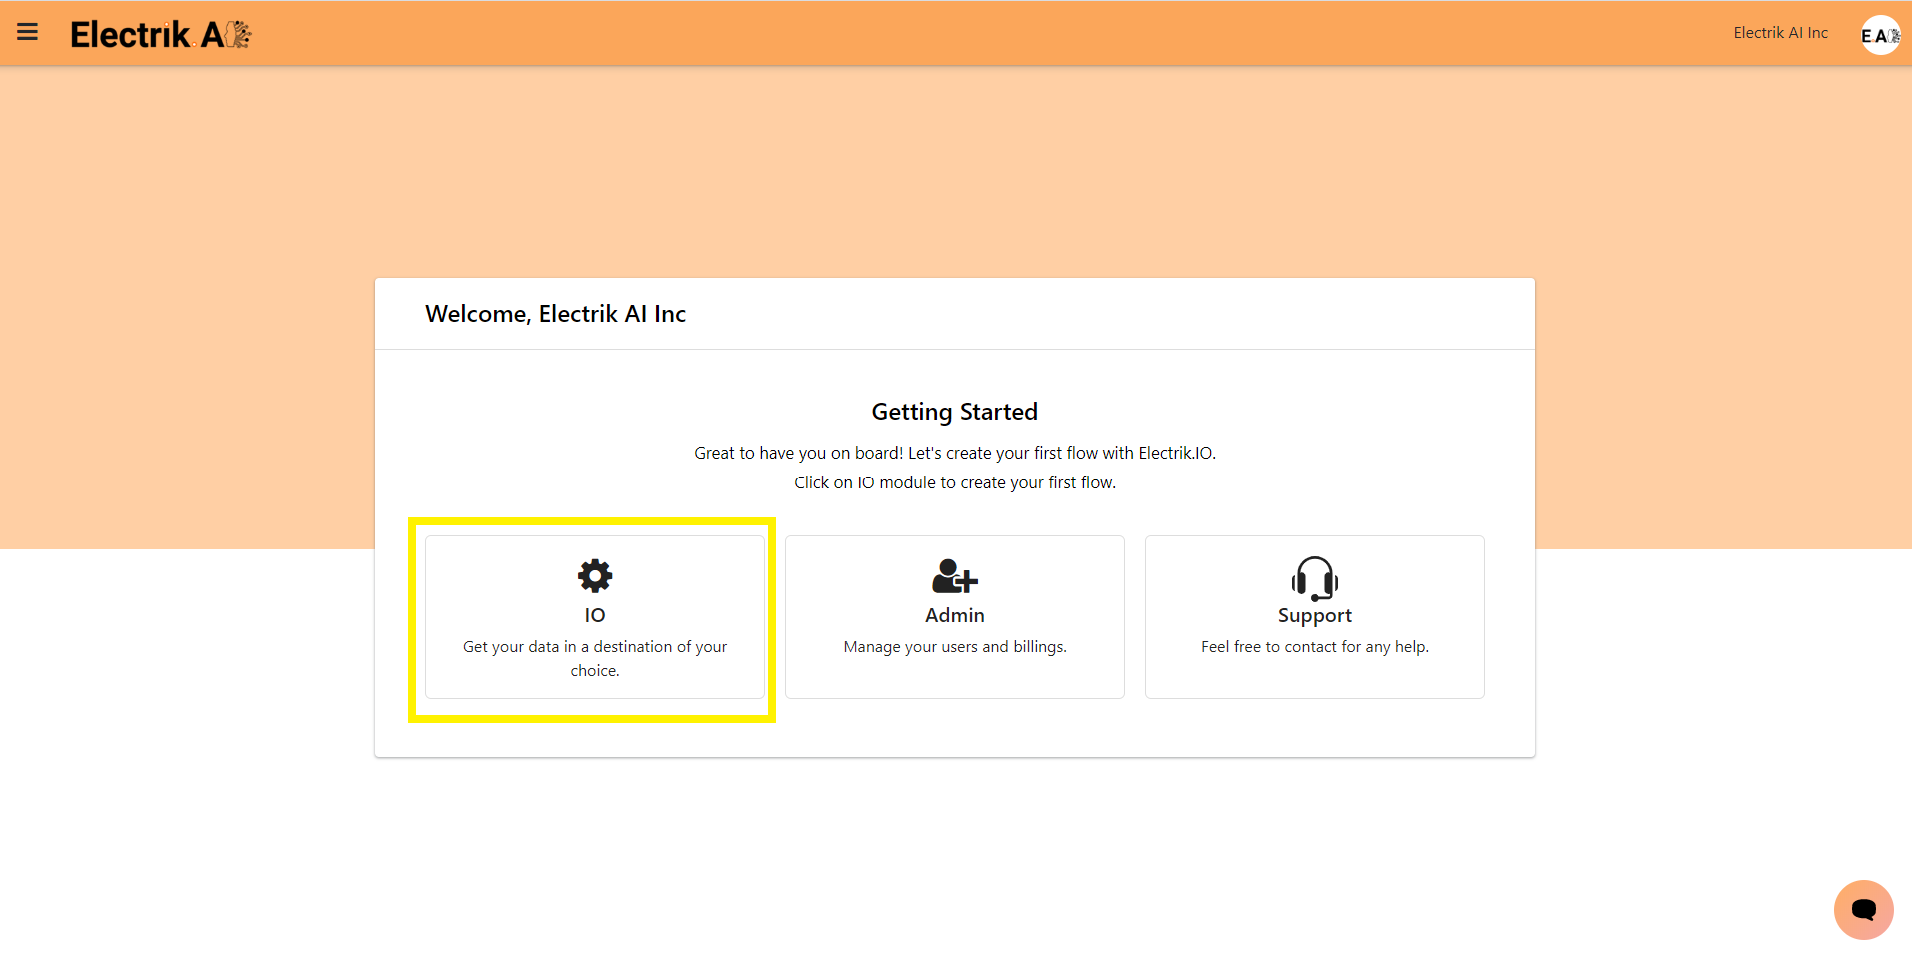
Step 3: Select IO in Electrik.AI dashboard

Select IO in Electrik.AI dashboard

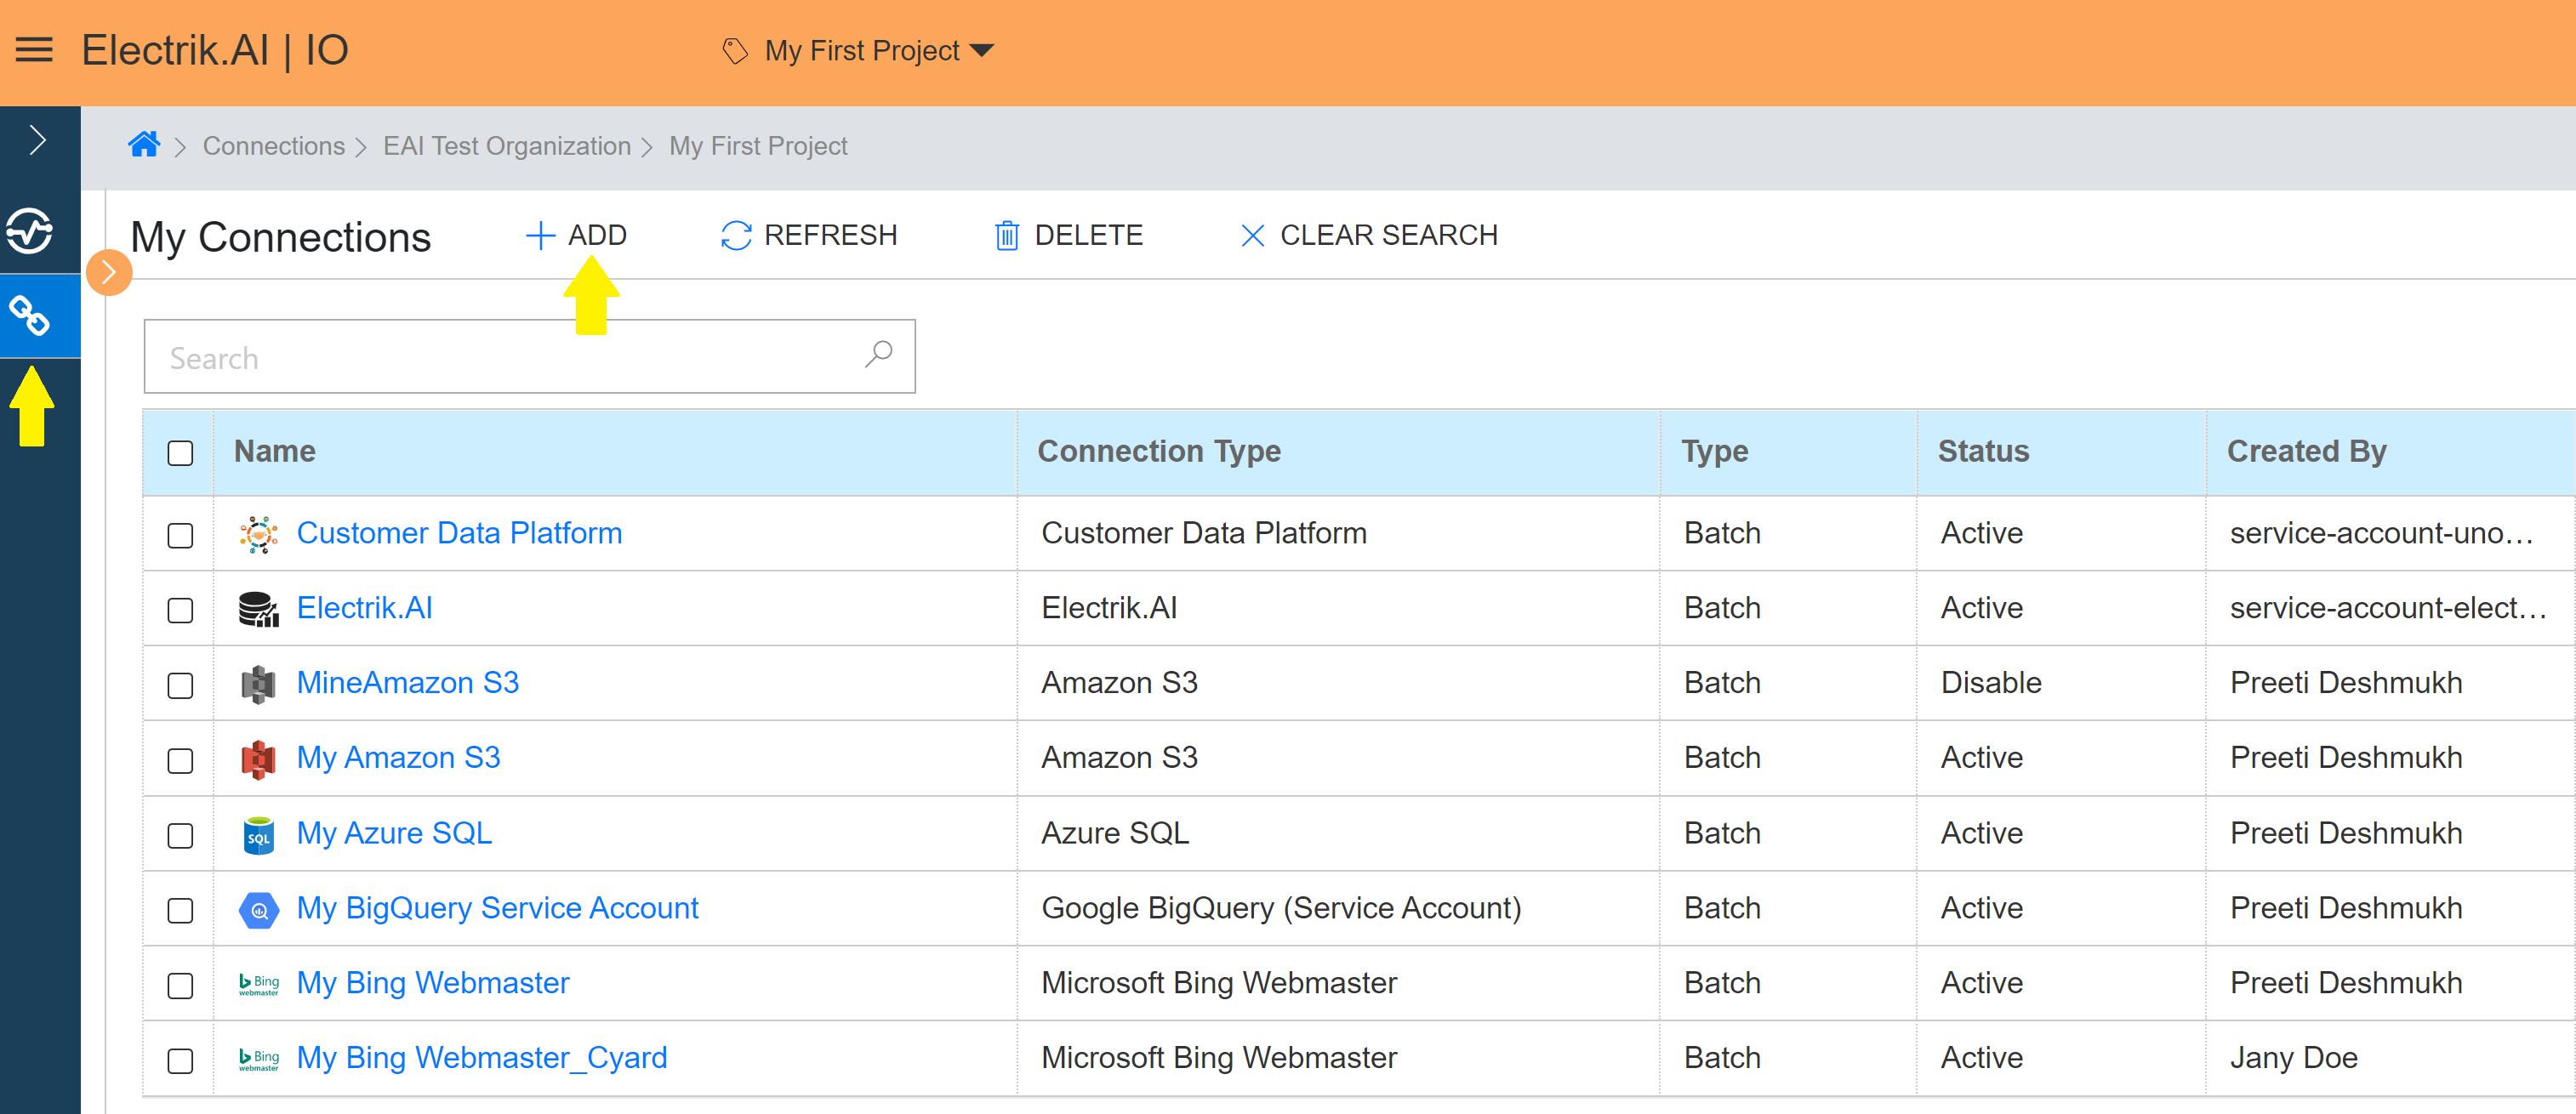
Step 4: Select the Connections tab in the left most navigation bar & click on “Add” action button.

Select-the-Connections-tab-in-the-left-most-navigation-bar-click-on-Add-action-

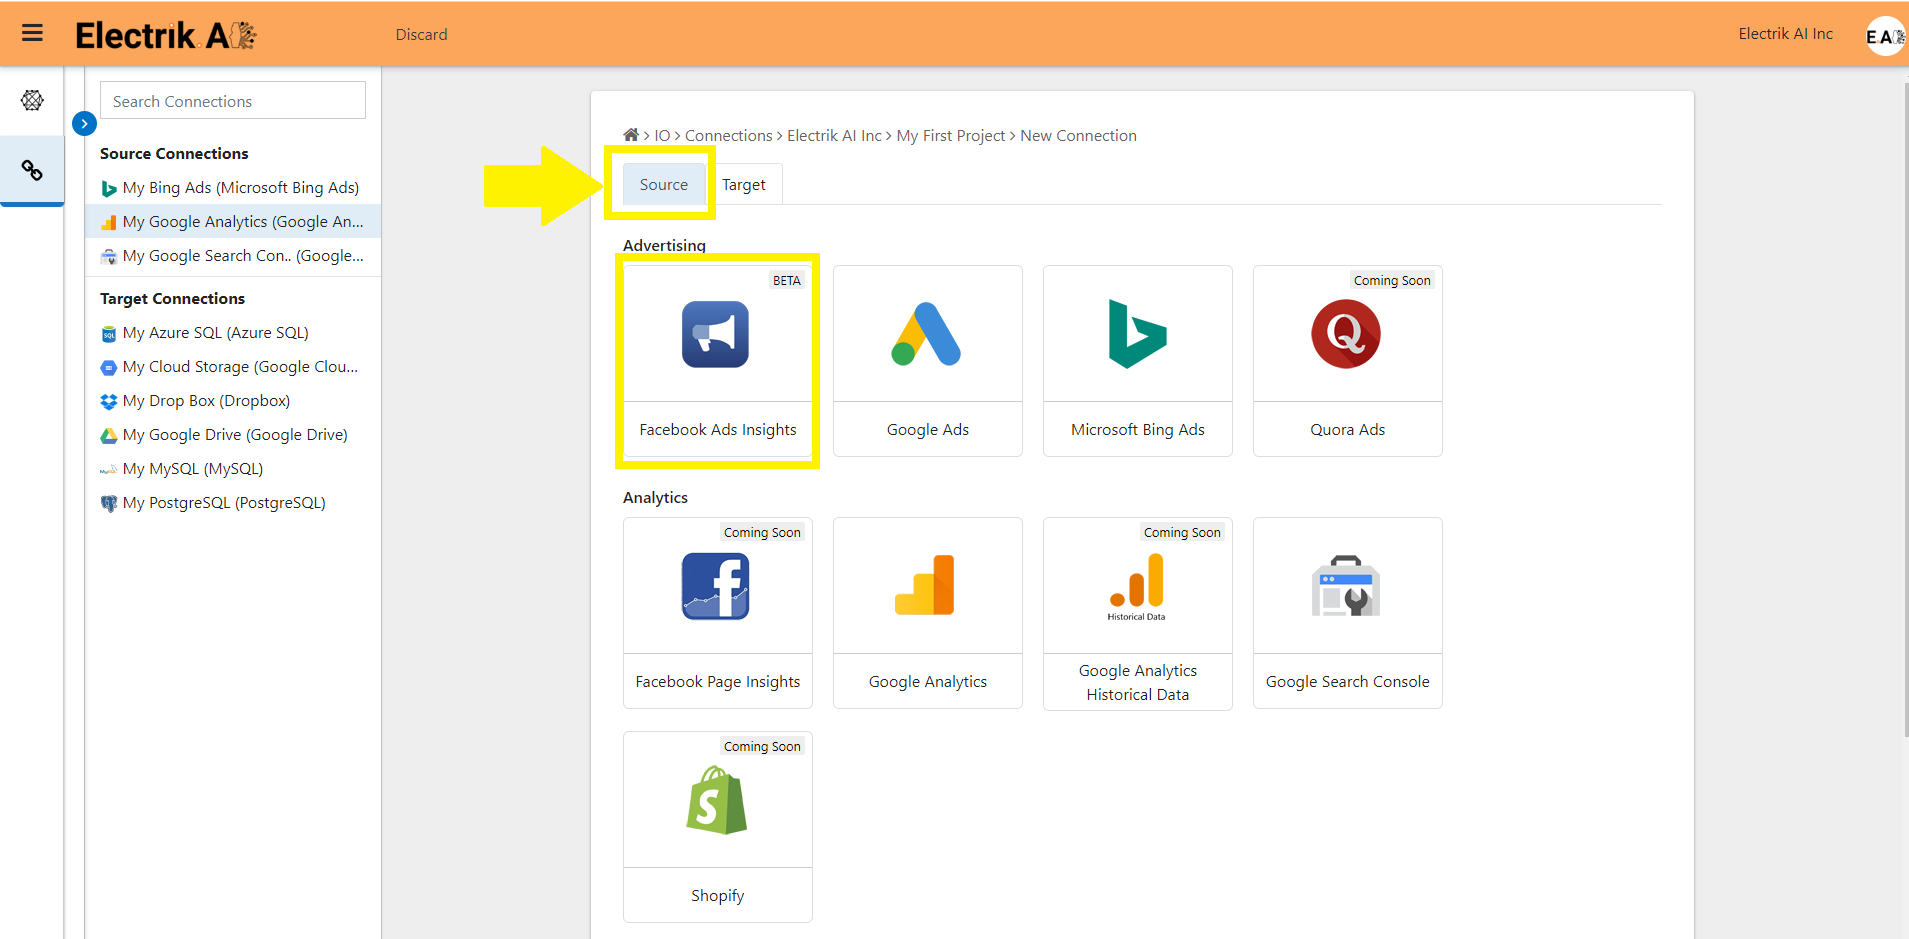
Step 5: The Source default tab is selected just click on “Facebook Ads Insights” connection.

Step 6 The Source default tab is selected just click on “FBAds” connection-ElectrikAI

Step 6: Provide your Facebook Ads account User Id and Password.

Step 7 Provide your Facebook Ads account User Id and Password-ElectrikAI

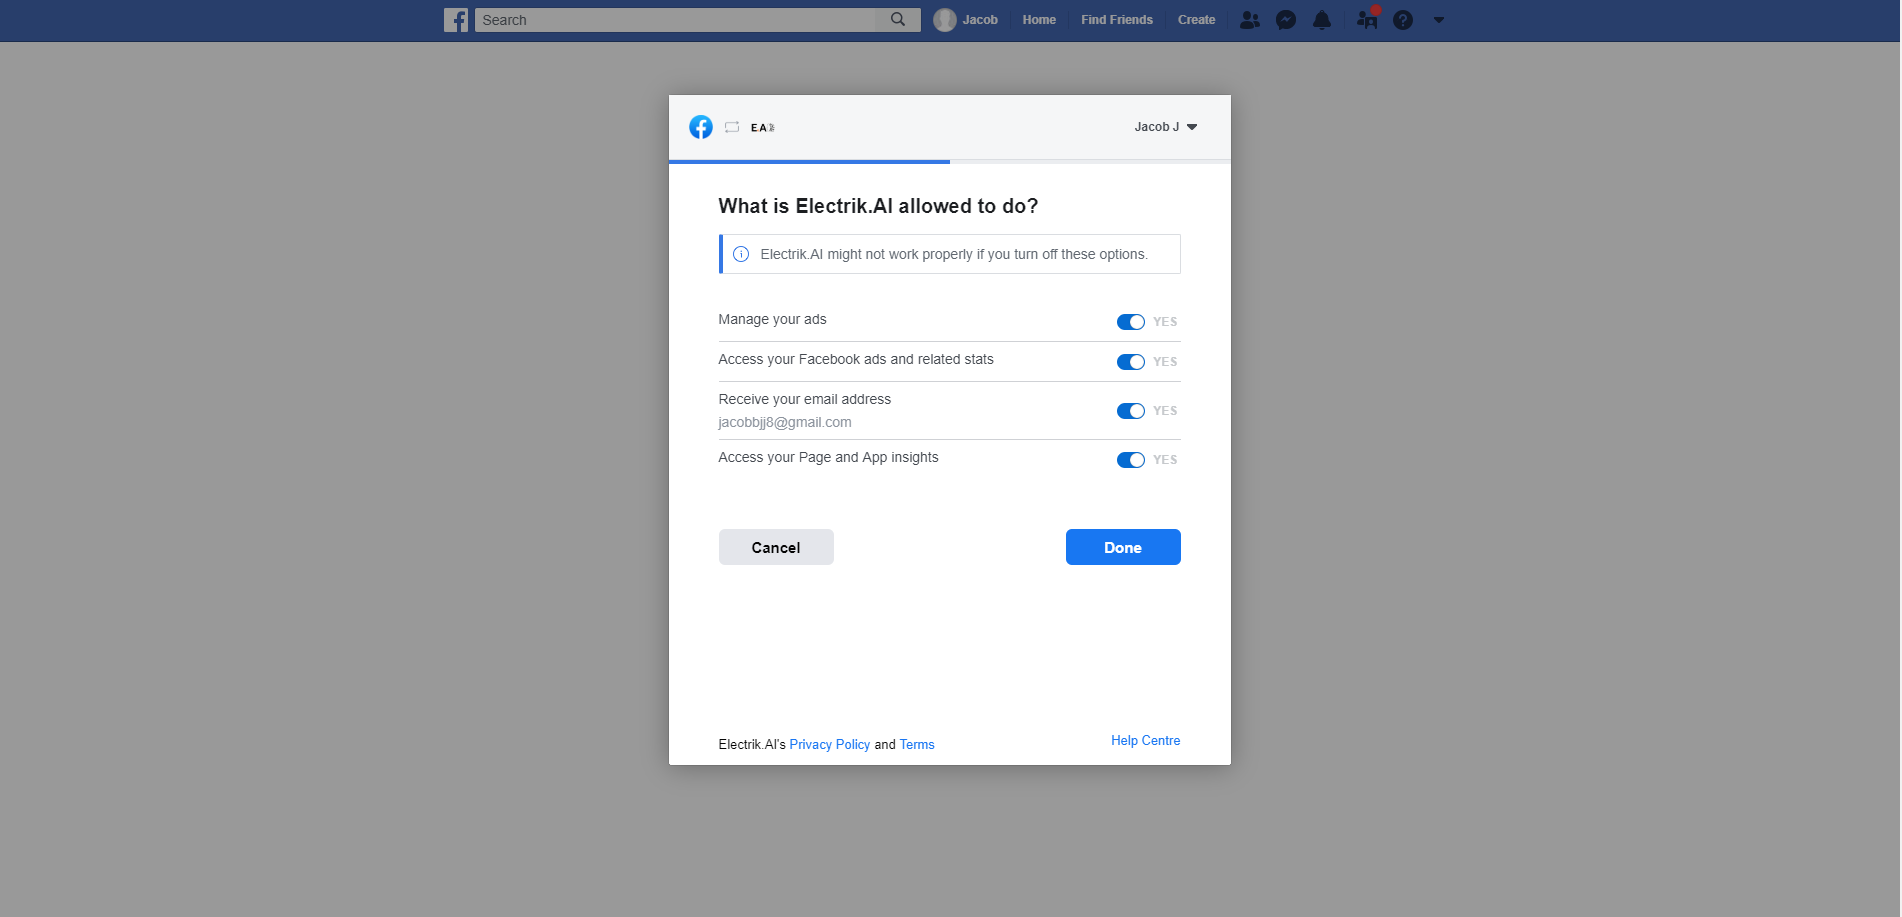
Step 7: Allow Electrik.AI to access your Facebook Ads account.

Step 8 Allow access your Facebook Ads account-ElectrikAI

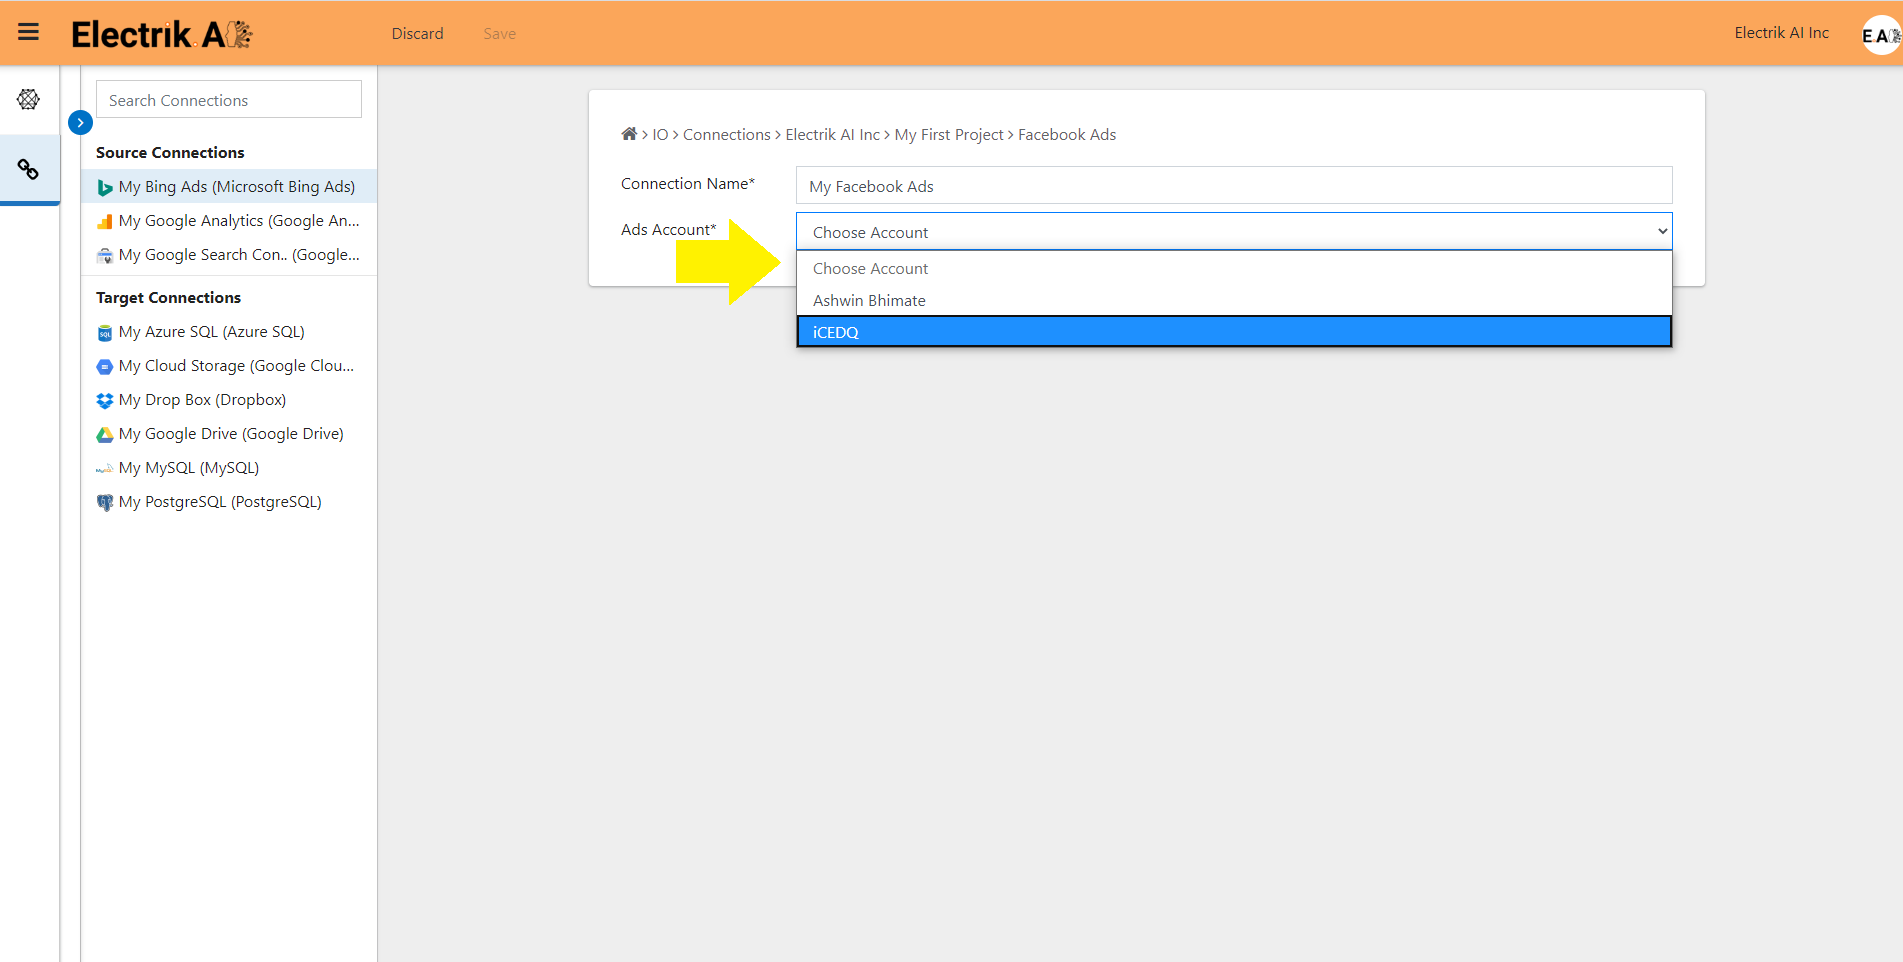
Step 8: Select the Ads Account from the dropdown whose data you wish to export.

Step 9 Select the Ads Account from the dropdown-ElectrikAI

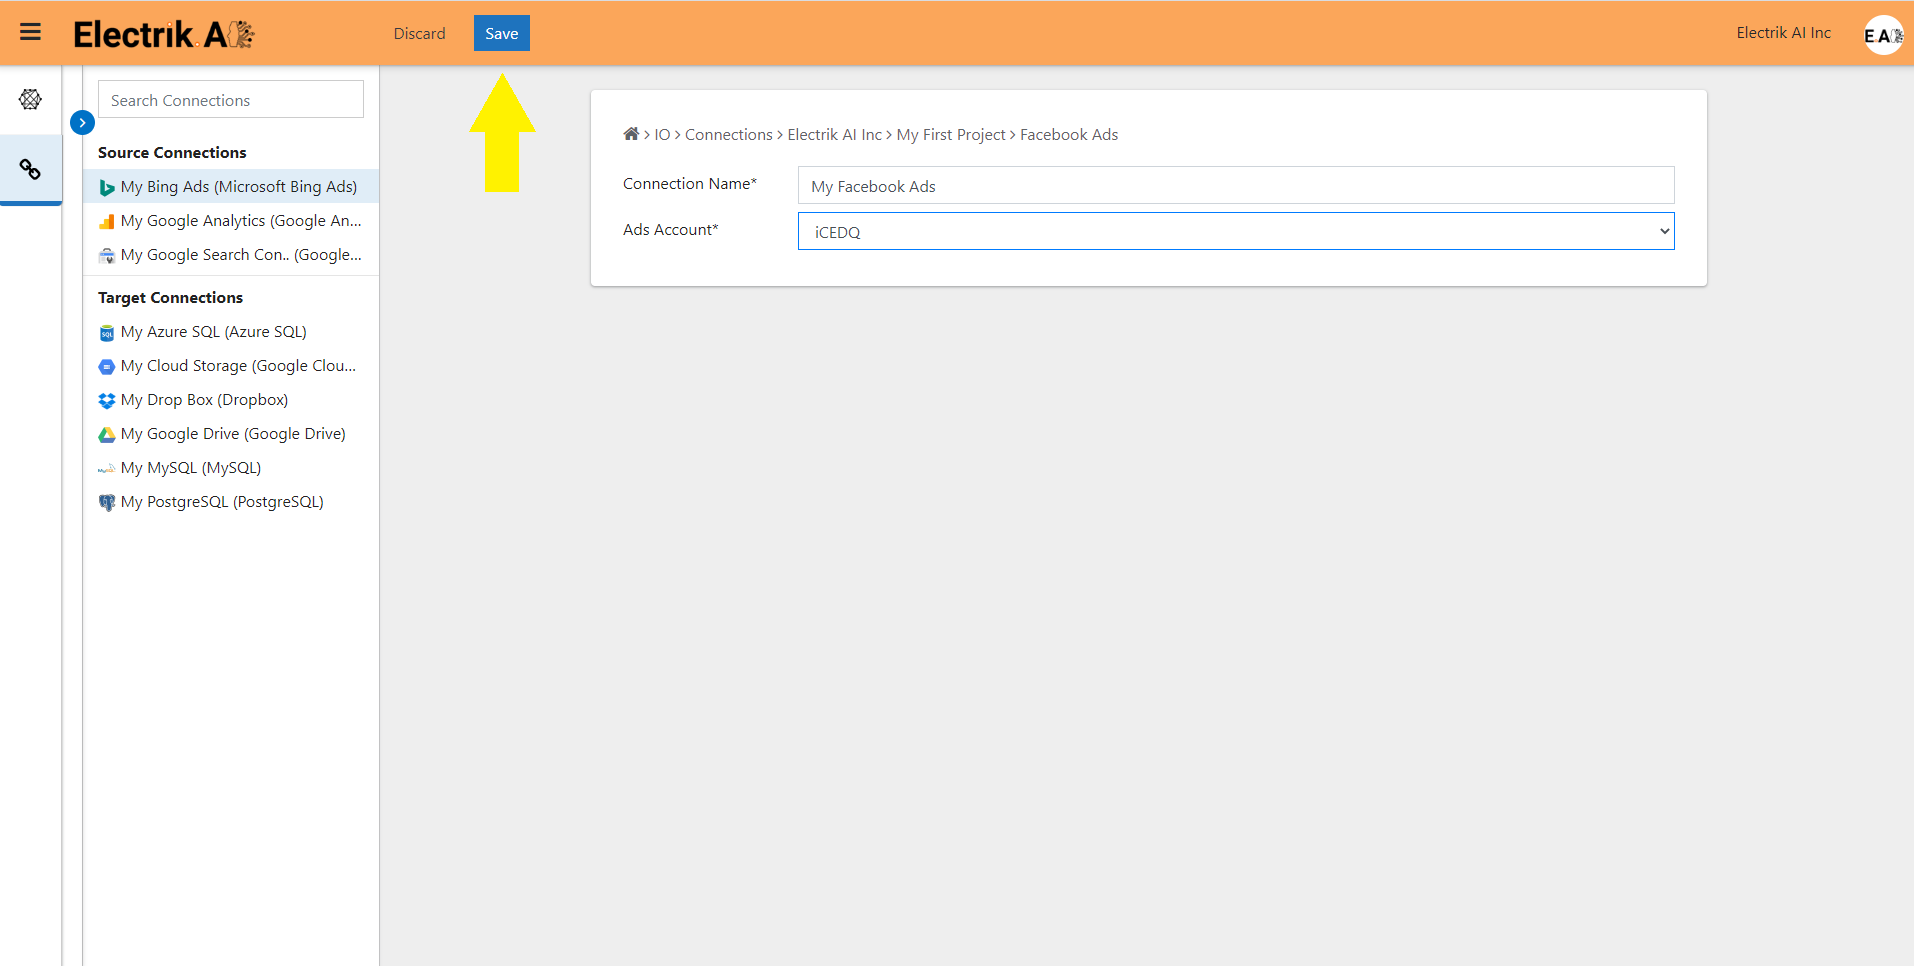
Step 9: Click on Save button on the top.

Step 10 Click on Save button on the top-ElectrikAI

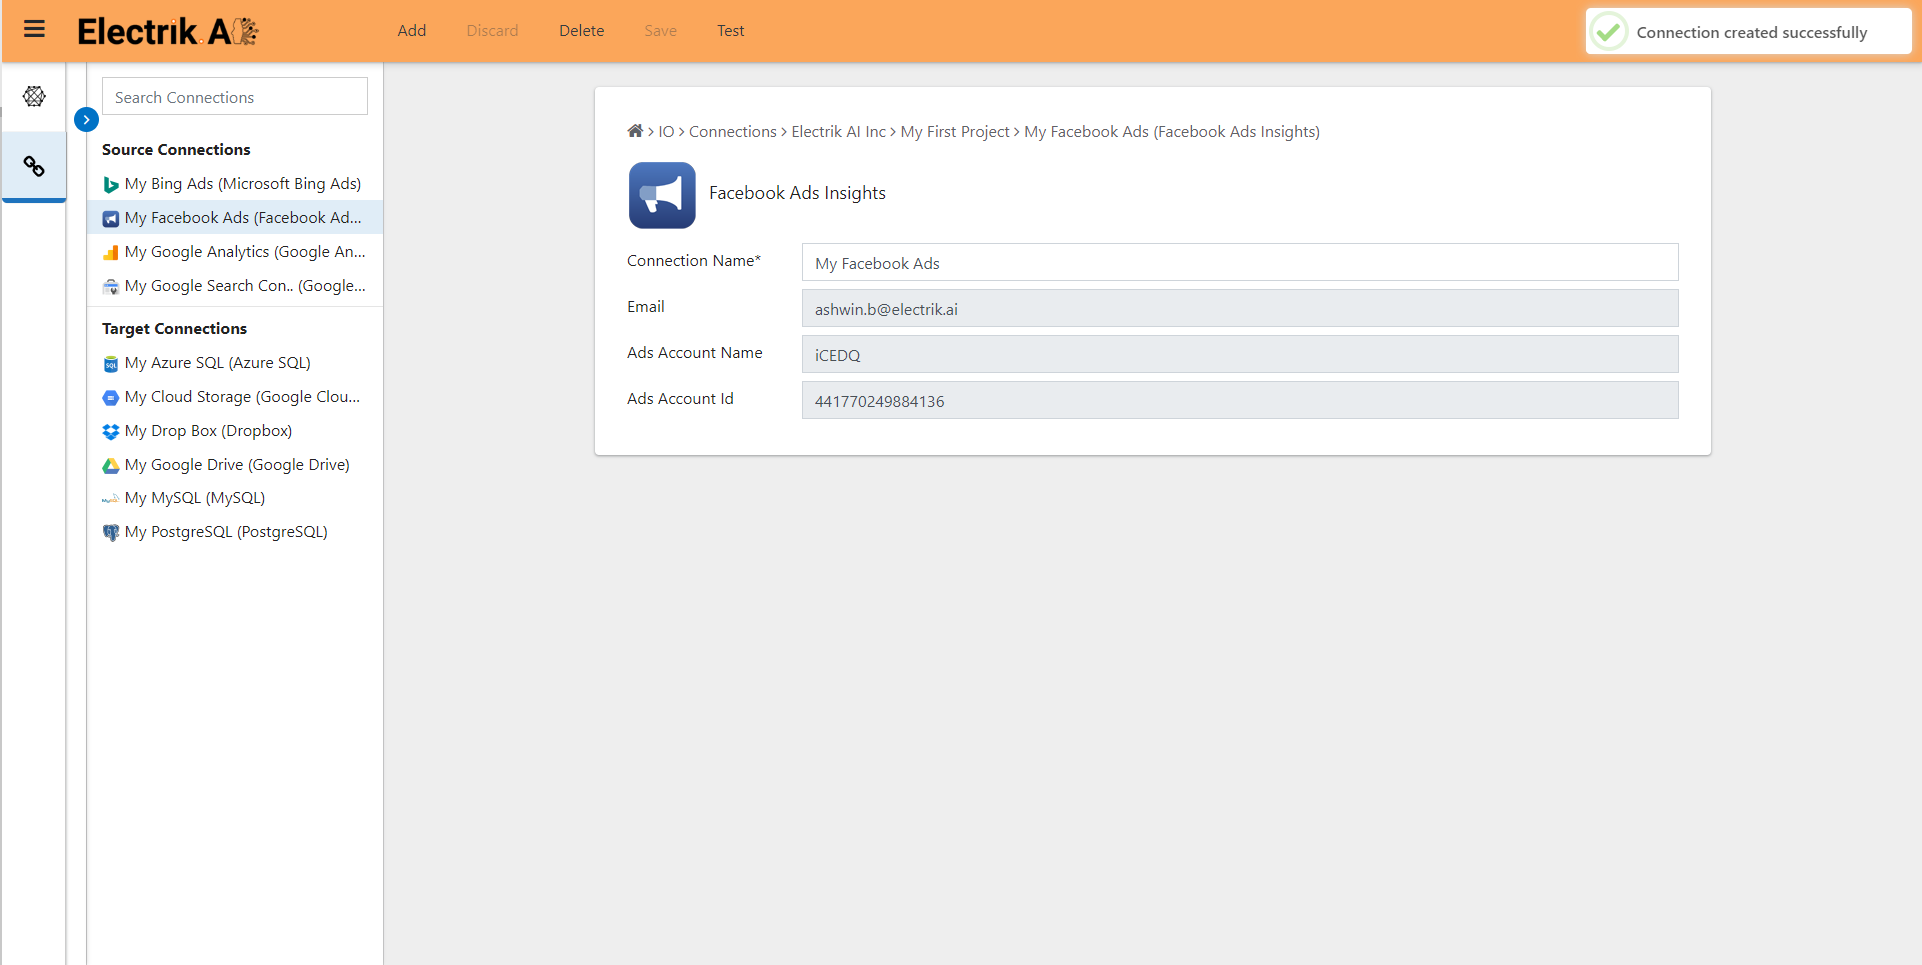
Congratulations, you have successfully created a Facebook Ads Connection in Electrik.AI.

Congratulations, you have successfully created a Facebook Ads Connection-ElectrikAI

What are the supported Data Destinations?

Electrik.AI supports the following databases to export Facebook Ads Data. It is important to note that Electrik.AI itself is not a destination. A destination is required to export data from various marketing data sources using Electrik.AI

PostgreSQL Data Destination-Eletrik.AI
MySQL Data Destination-Electrik.AI
AzureSQL Data Destination-Eletrik.AI
Google Big Query Data Destination-Elecrik.AI
Snowflake-Data-Destination-Electrik.AI

How to export Facebook Ads Data ?

Electrik.AI creates a data flow (or ETL process) that exports Facebook Ads data to a target database or data warehouse. This process runs daily at scheduled time and exports data for the previous day.

Follow these steps to create a Data Flow from Facebook Ads to Database

Step 1: Ensure you have the following prerequisites.

1. Access to Facebook Ads.

2. Facebook Ads Account User Id and Password.

3. Access to a Database of your choice (PostgreSQL, MySQL, Azure SQL, BigQuery.)

4. Database Connection Details such as Host, Port, DB Name, DB User, DB Password.

Step 2: Sign-in into your Electrik.AI account.

Step 3: Select IO in Electrik.AI dashboard.

Select IO in Electrik.AI dashboard-ElectrikAI

Step 4: Click on Add button to create a Facebook Ads – Facebook Ads Performance Data Extractor Flow.

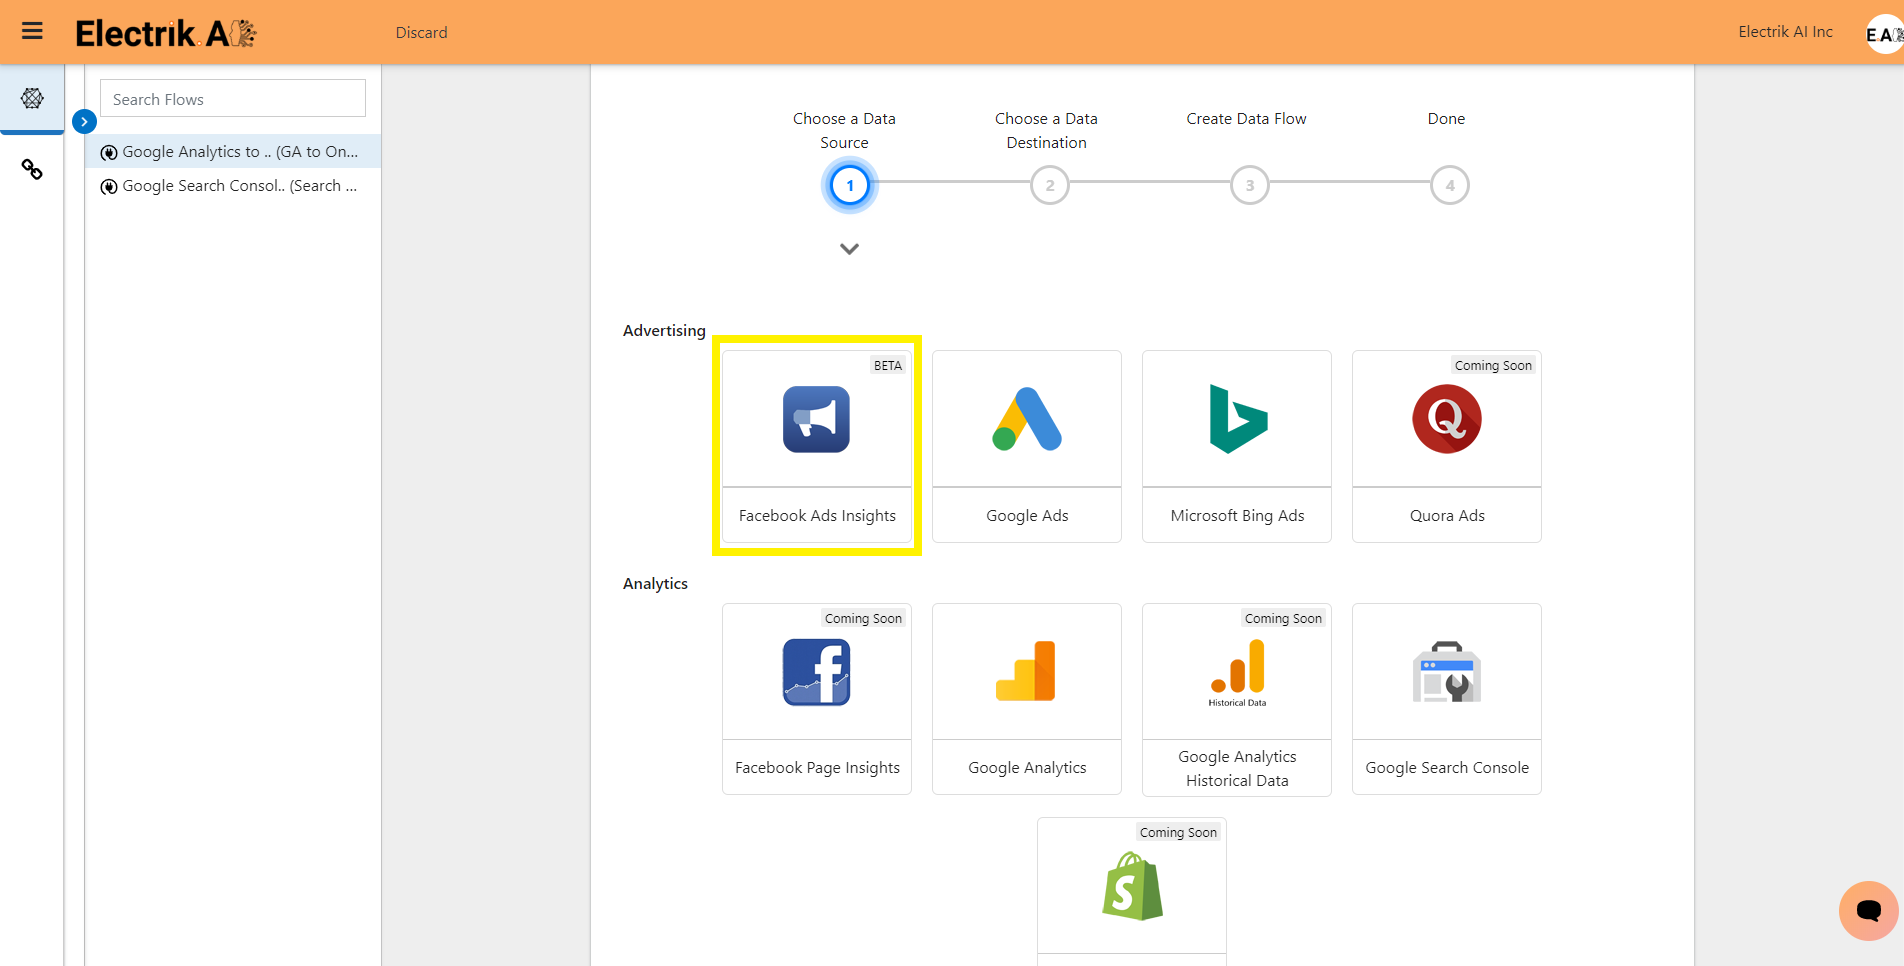
Step 5: Select Facebook Ads Connection present in the list of available sources.

Flow Step 5 Select Facebook Ads Connection-ElectrikAI

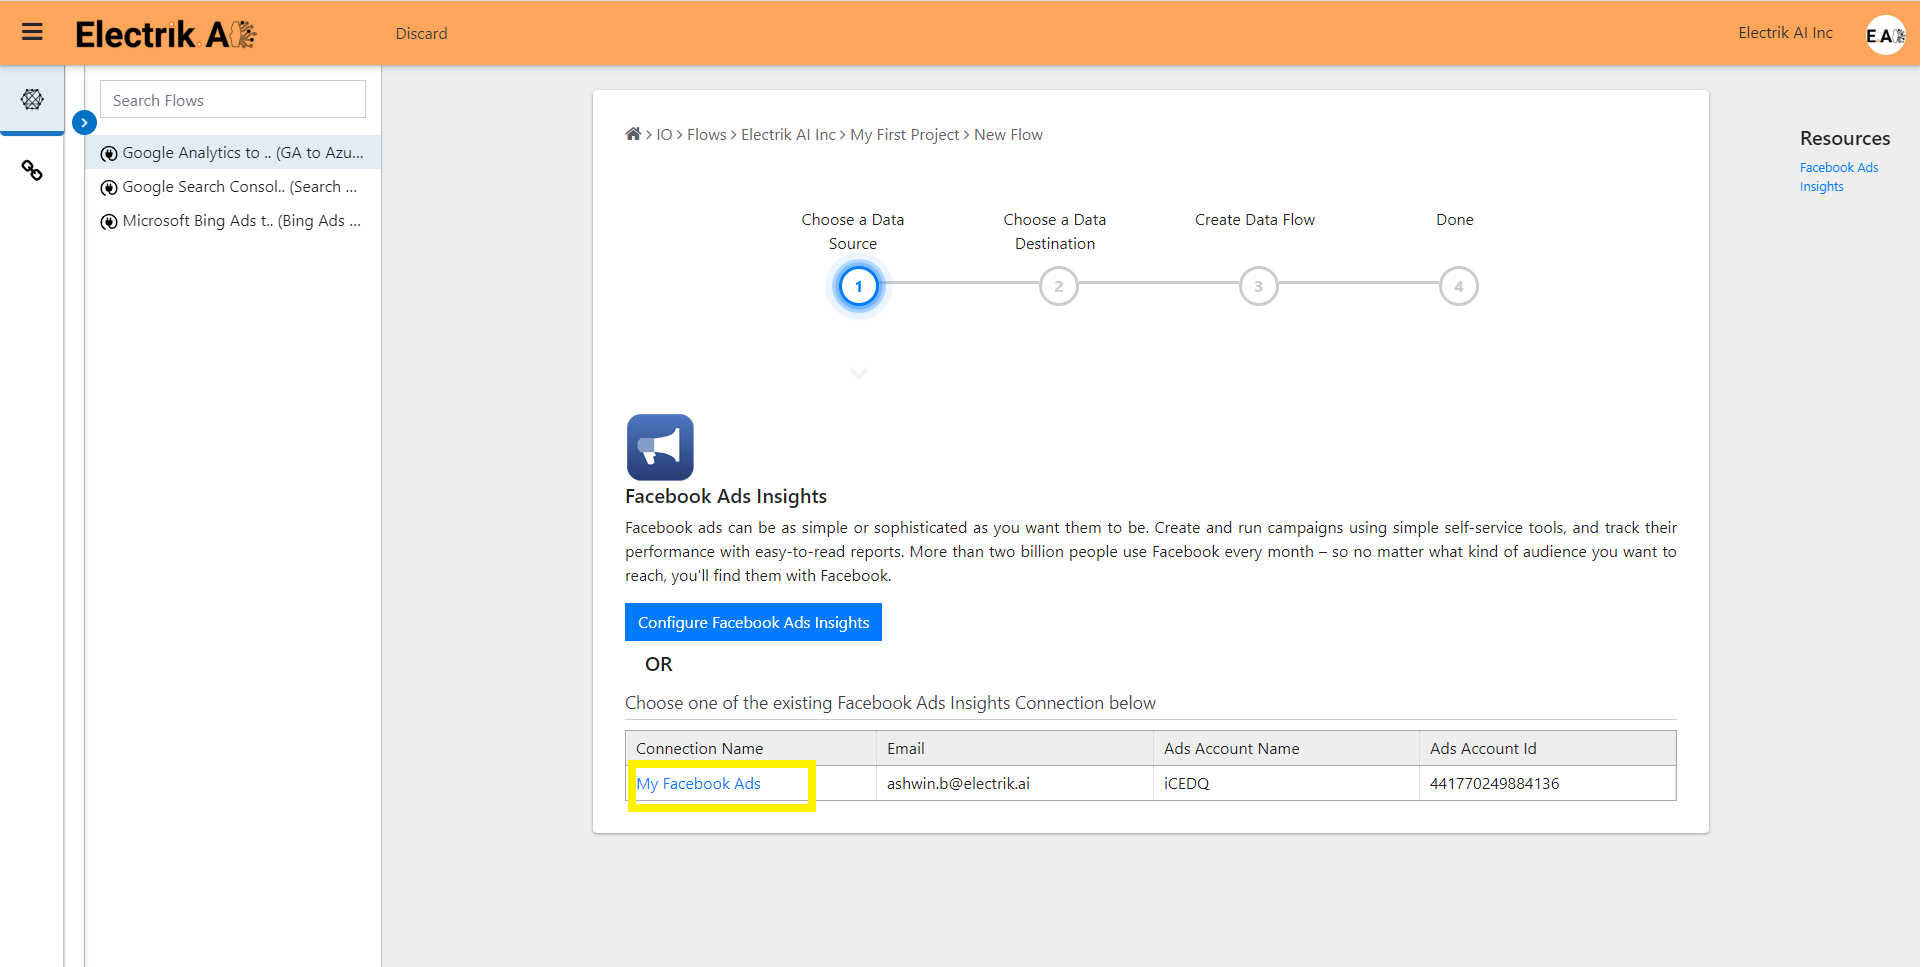
Step 6: Select your existing Facebook Ads connection in Electrik.AI.

Step 6 Select your existing Facebook Ads connection in ElectrikAI

To Configure a new connection, refer to this link.

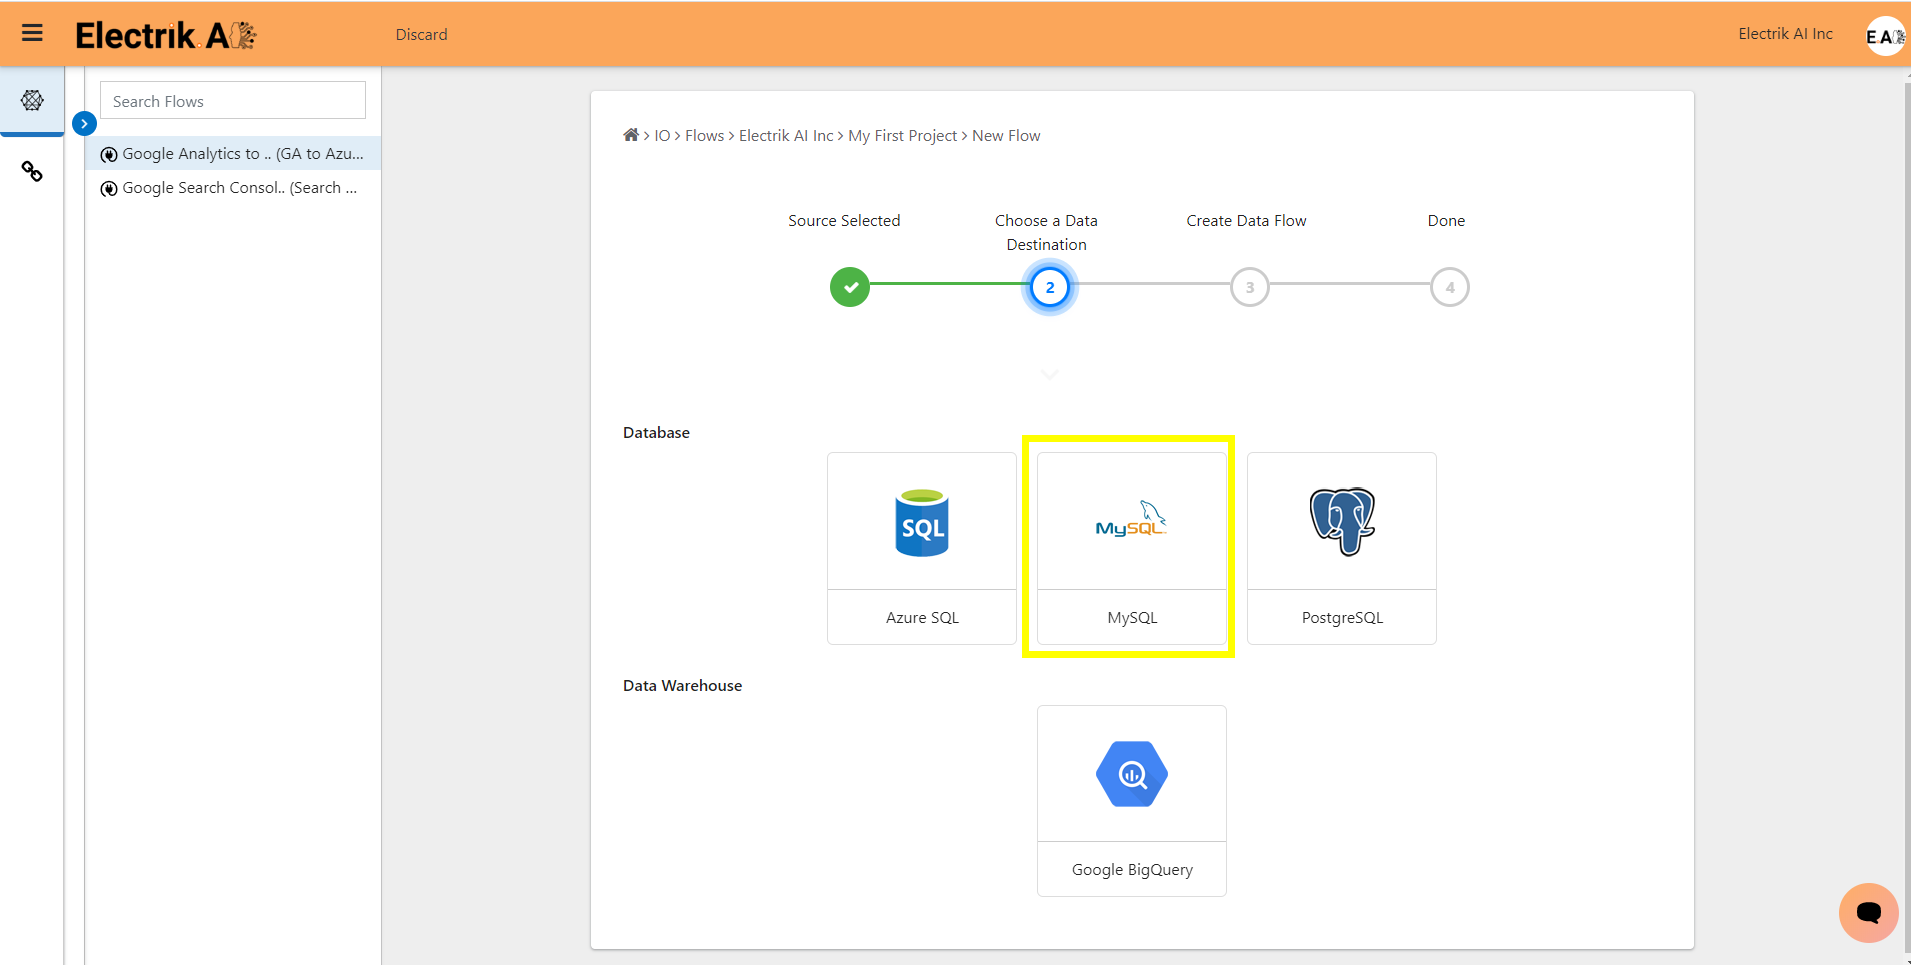
Step 7: Click on a database of your choice from list of available destinations.
In this example we are choosing My SQL. 

Step 7 select destination mysql-ElectrikAI

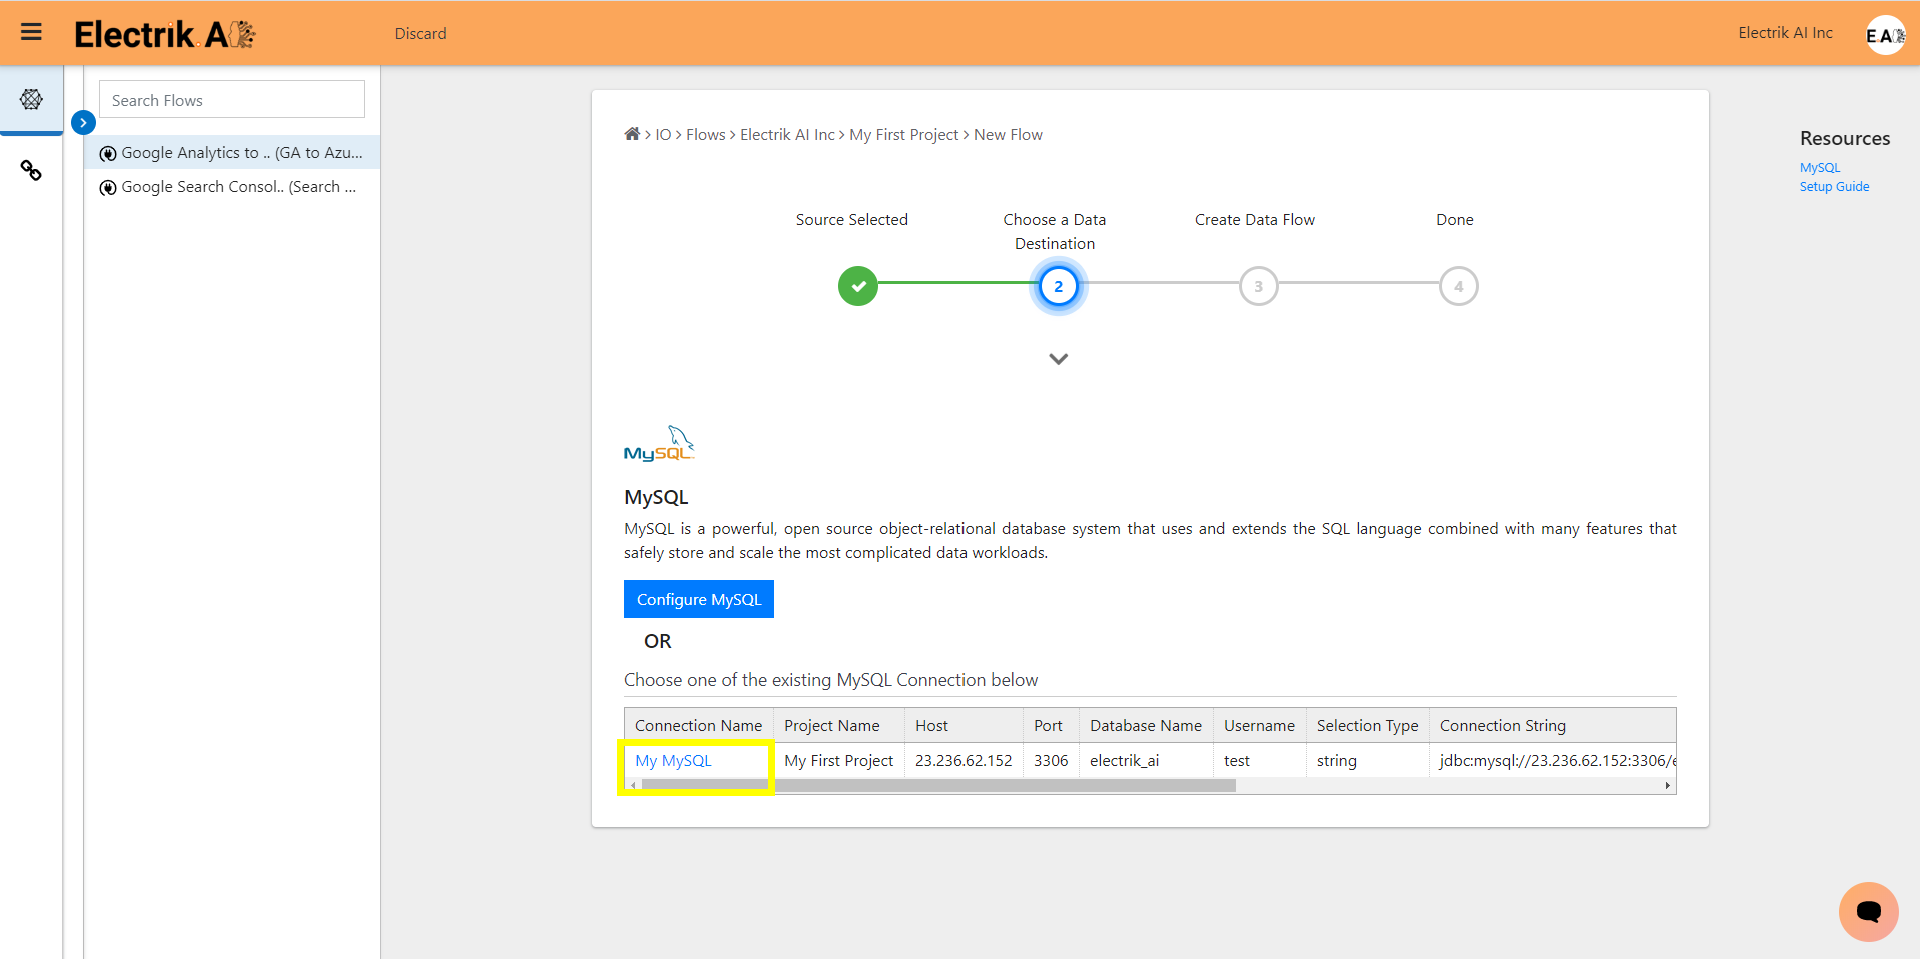
Step 8: Select your existing MySQL connection in Electrik.AI.
To Configure a new connection, refer to this link.

Step 8 Select existing mysql-ElectrikAI

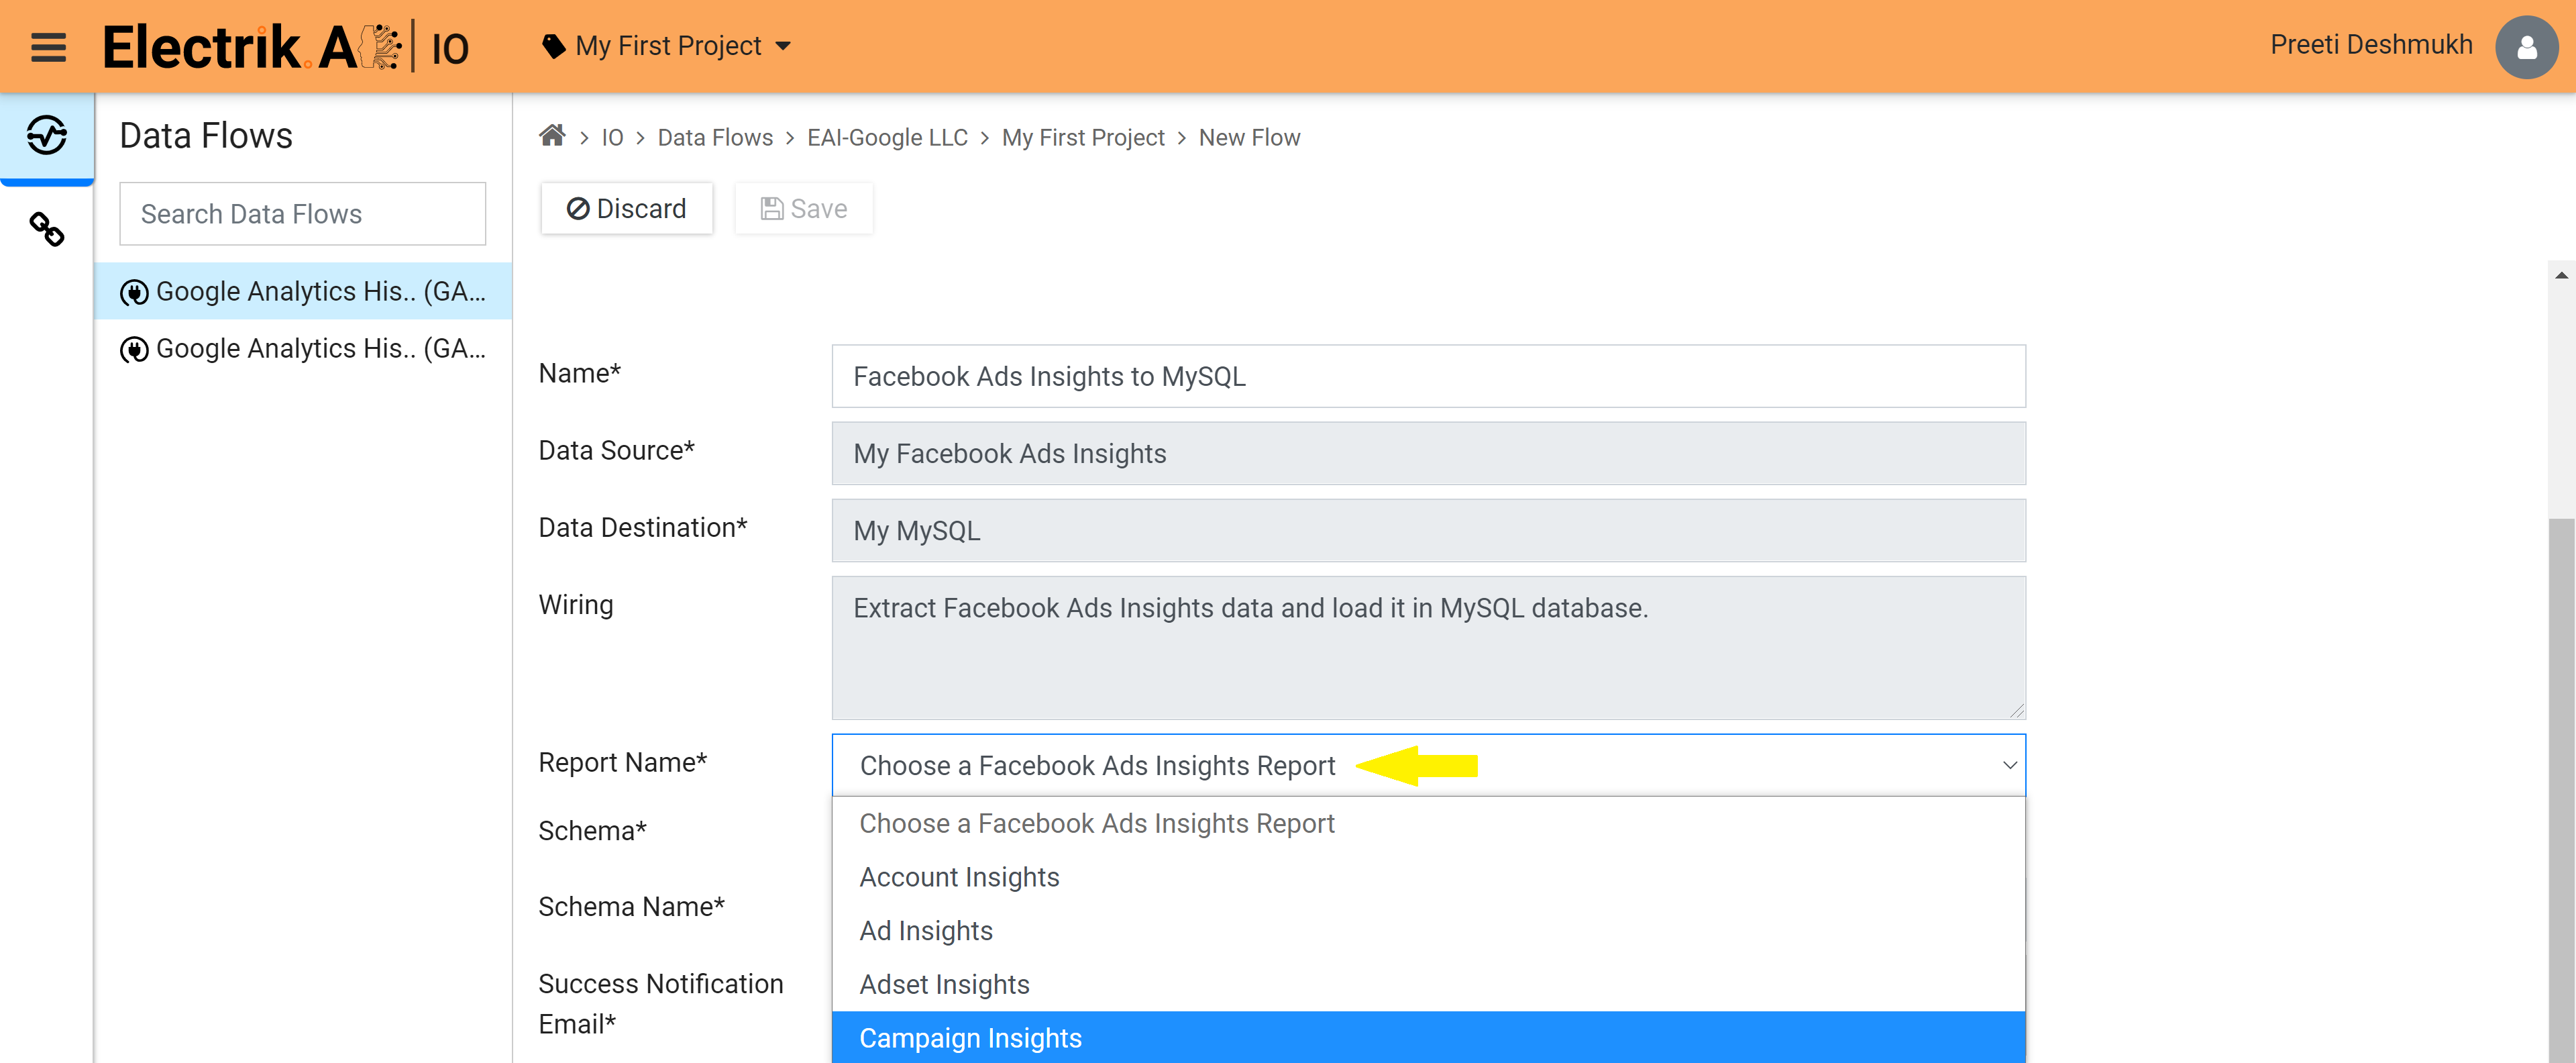
Step 9: a. Electrik.AI now supports 4 reports, choose the desired type to get the appropriate data. In this example we are choosing Campaign Insights.

Electrik.AI now supports 4 reports

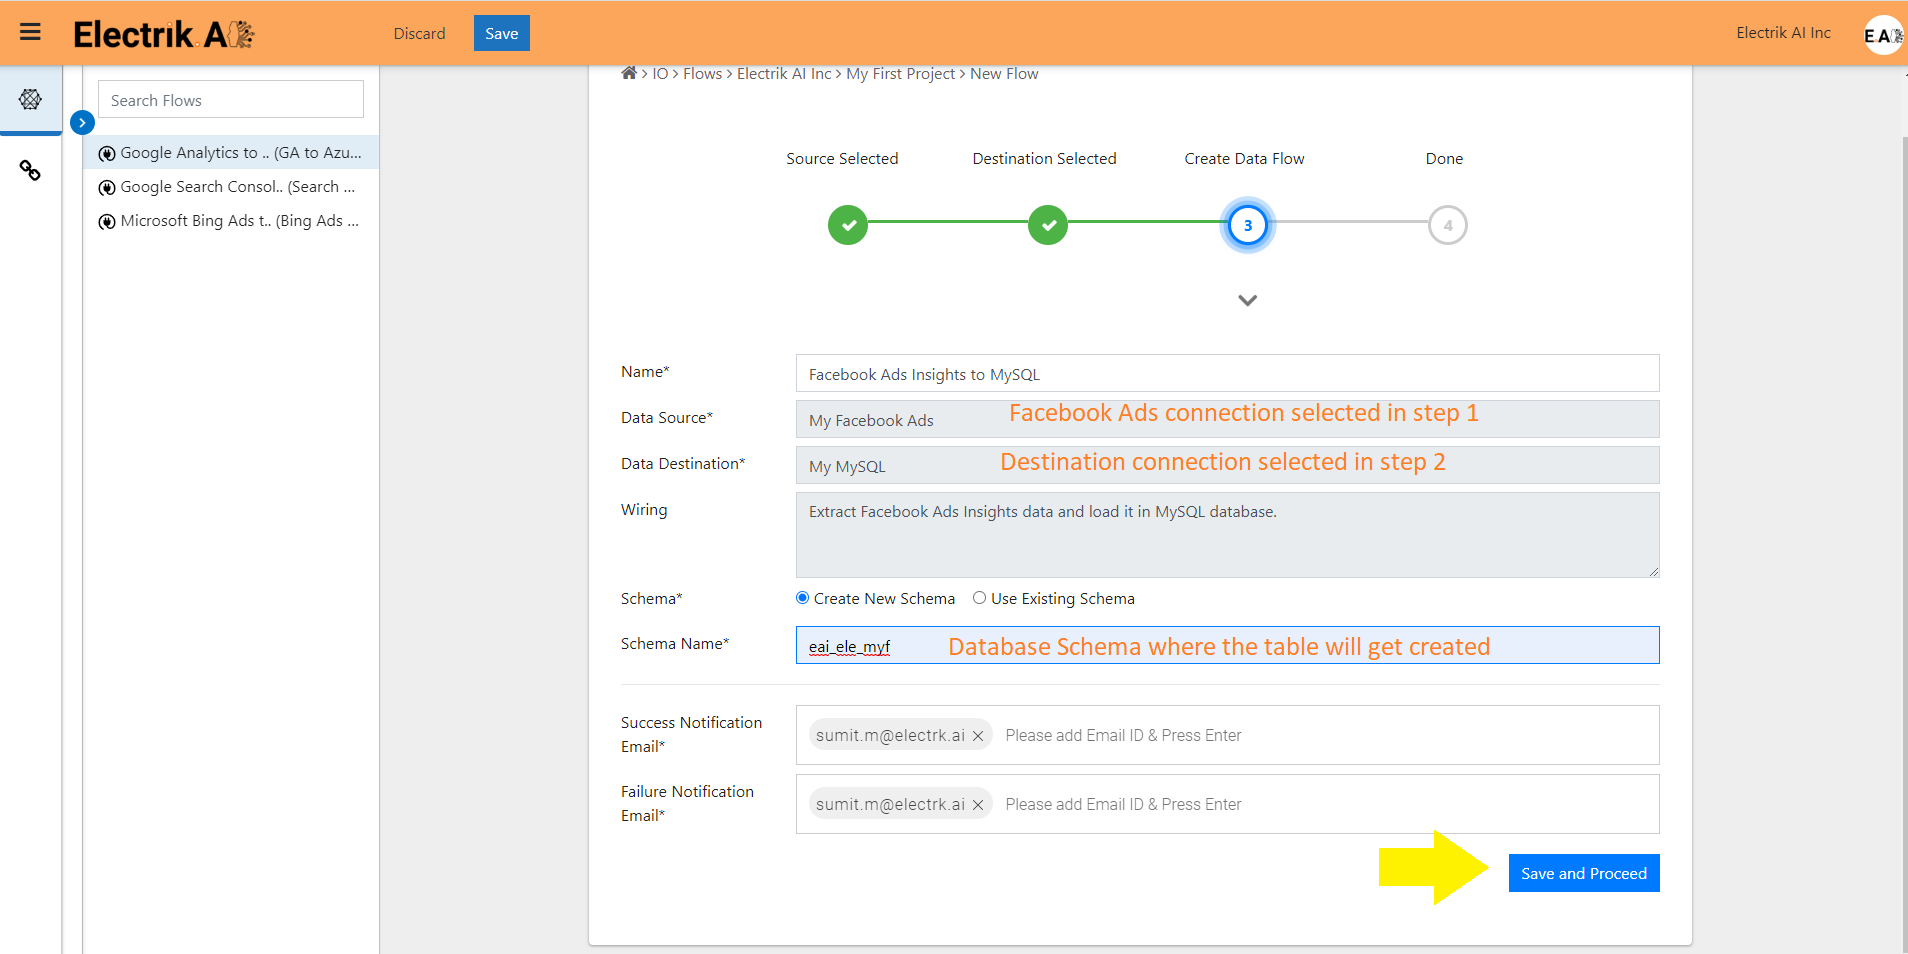
b. Review the Data Source, Data Destination, Database Schema, Report Name, Provide Success Notification Email, Failure Notification Email.

Success Notification Email: Enter a valid Email ID to receive the Flow Success Email Notification.
Failure Notification Email: Enter a valid Email ID to receive the Flow Failure Email Notification.
Note: By Default, Electrik.AI uses the signed-in user’s Email Id.

c. Click “Save and Proceed” to continue.

Step 9 Review the Data Source-ElectrikAI

Note: By Default, Electrik.AI chooses an existing Database Schema to load your Facebook Ads Report. You can create a new schema in your database by selecting the “Create New Schema” radio button.

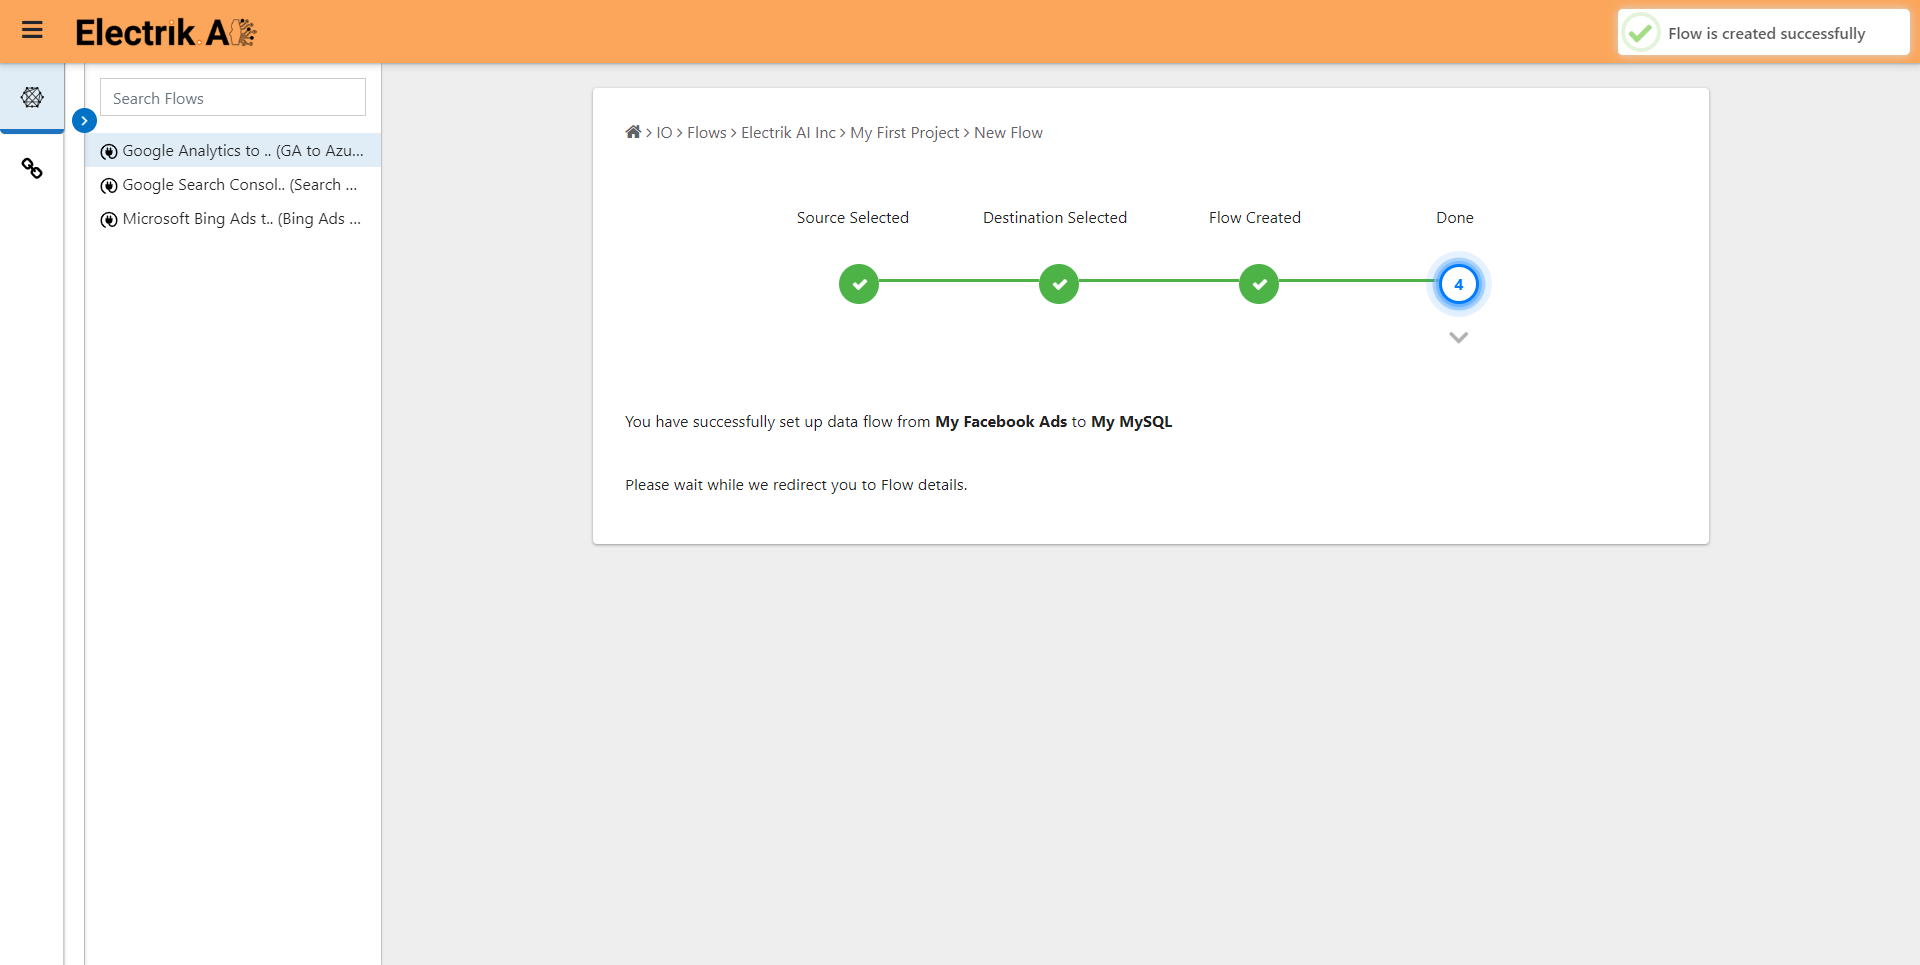
Step 10: Congratulations, Flow is created. Please wait while you are redirected to Flow Details Screen.

Step 10 Congratulations, Flow is created-ElectrikAI

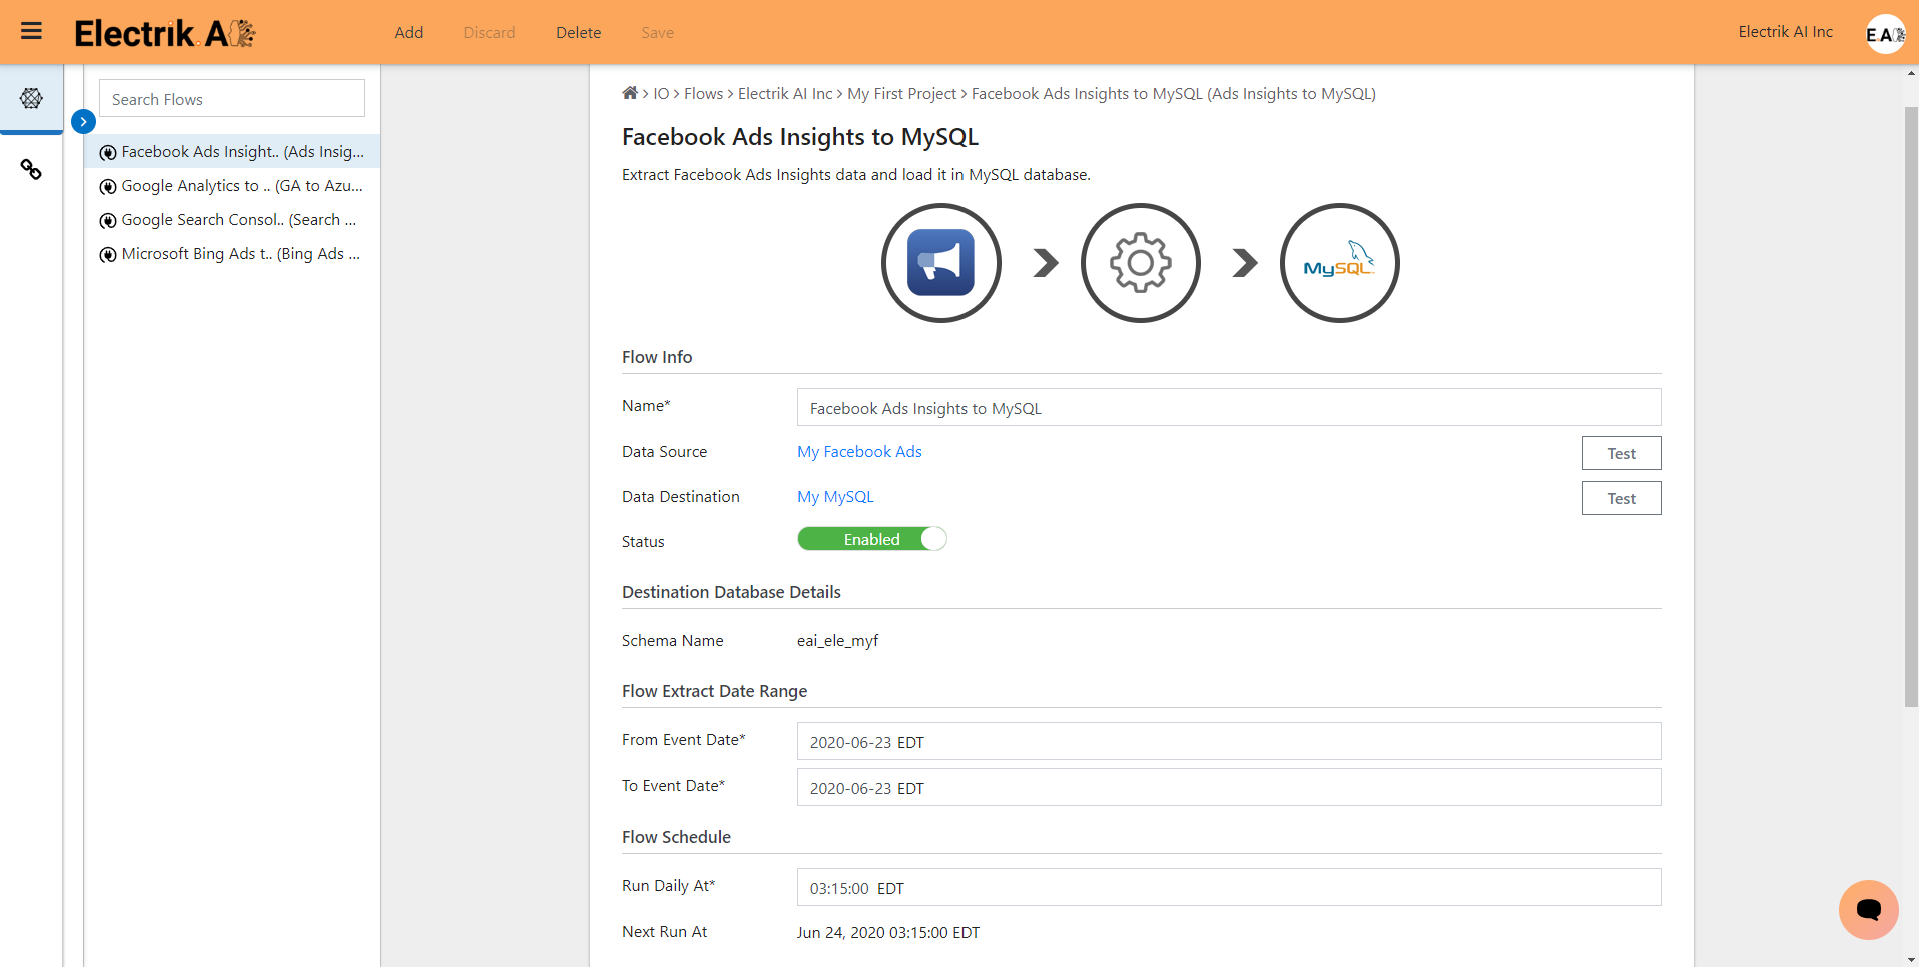
You have now successfully setup Facebook Ads Performance Report to MySQL Database flow in Electrik.AI

You have now successfully setup Facebook Ads Performance Report to MySQL Database flow in Electrik.AI

Your Facebook Ads data will start loading after 24 hours in your Database.

Facebook Ads data will start loading after 24 hours-ElectrikAI

Facebook Ads Data Schema

The Ad Insights report includes all statistics aggregated at the ad level.

Index Category Electrik.AI Column Name Description Sample Value
1 Dimension account_currency Currency that is used by your ad account. USD
2 Dimension account_id The ID number of your ad account, which groups your advertising activity. Your ad account includes your campaigns, ads and billing. 441760000000000
3 Dimension account_name The name of your ad account, which groups your advertising activity. Your ad account includes your campaigns, ads and billing. Electrik.AI
4 Metrics action_values The total value of all conversions attributed to your ads.
5 Metrics actions The total number of actions people took that are attributed to your ads. Actions may include engagement, clicks or conversions. [action_type:link_click, value:26], [action_type:landing _page_view, value:3], [action_type:post_ engagement,value:26] ,[action_type:page_ engagement,value:26]
6 Metrics actions_link_click actions_link_click 11
7 Metrics actions_landing _page_view actions_ landing_page _view 4
8 Metrics actions_post_ engagement actions_post_ engagement 150
9 Metrics actions_page_ engagement actions_page _engagement 150
10 Metrics actions_video _view actions_video _view 139
11 Metrics ad_click_actions ad_click_actions
12 Dimension ad_id The unique ID of the ad you’re viewing in reporting. 23845273720540100
13 Metrics ad_impression _actions ad_impression _actions
14 Dimension ad_name The name of the ad you’re viewing in reporting. Video Ad
15 Dimension adset_id The unique ID of the ad set you’re viewing in reporting. An ad set is a group of ads that share the same budget, schedule, delivery optimization and targeting. 23845273720 500600
16 Dimension adset_name The name of the ad set you’re viewing in reporting. An ad set is a group of ads that share the same budget, schedule, delivery optimization and targeting. GA Interest Audience
17 Dimension age_targeting age_targeting
18 Metrics auction_bid auction_bid
19 Metrics auction_ competitiveness auction_ competitiveness
20 Metrics auction_max_ competitor_bid auction_max_ competitor_bid
21 Dimension buying_type The method by which you pay for and target ads in your campaigns: through dynamic auction bidding, fixed-price bidding, or reach and frequency buying. This field is currently only visible at the campaign level. AUCTION
22 Dimension campaign_id The unique ID number of the ad campaign you’re viewing in reporting. Your campaign contains ad sets and ads. 23885273720480700
23 Dimension campaign_name The name of the ad campaign #you’re viewing in reporting. Your campaign contains ad sets and ads. Evergreen_EAI_ BrandAwareness
24 Metrics canvas_avg_view _percent The average percentage of the Instant Experience that people saw. An Instant Experience is a screen that opens after someone interacts with your ad on a mobile device. It may include a series of interactive or multimedia components, including
video, images product catalog and more.
25 Metrics canvas_avg_ view_time The average total time, in seconds, that people spent viewing an Instant Experience.An Instant Experience is a screen that opens after someone interacts with your ad on a mobile device. It may include a series of interactive or multimedia
components, including video, images product catalog and more.
26 Metrics catalog_segment _actions The number of actions performed attributed to your ads promoting your catalog segment, broken down by action type.
27 Metrics catalog_segment _value The total value of all conversions from your catalog segment attributed to your ads.
28 Metrics catalog_segment_ value_mobile_purchase_ roas The total return on ad spend (ROAS) from mobile app purchases for your catalog segment.
29 Metrics catalog_segment_ value_omni_purchase _roas The total return on ad spend (ROAS) from all purchases for your catalog segment.
30 Metrics catalog_segment_ value_website_purchase _roas The total return on ad spend (ROAS) from website purchases for your catalog segment.
31 Metrics clicks The number of clicks on your ads. 11
32 Metrics conversion_ values conversion_ values
33 Metrics conversions conversions
34 Metrics converted_product _quantity The number of products purchased which are recorded by your merchant partner’s pixel or app SDK for a given product ID and driven by your ads. Has to be used together with converted product ID breakdown.
35 Metrics converted_product _value The value of purchases recorded by your merchant partner’s pixel or app SDK for a given product ID and driven by your ads. Has to be used together with converted product ID breakdown.
36 Metrics cost_per_15_sec_ video_view cost_per_15_sec _video_view 0.038
37 Metrics cost_per_2_sec_ continuous_video_view cost_per_2_sec_ continuous_video_view
38 Metrics  cost_per_action _type The average cost of a relevant action. [action_type: landing_page_view, value:1.14],[action _type:video_view, value:0.032806], [action_type:link _click, value:0.414545], [action_type: post_engagement, value:0.0304], [action_type: page_engagement, value:0.0304]
39 Metrics cost_per _action_type_ link_click cost_per_action_ type_link_click 0.414545
40 Metrics cost_per_ action_type_landing _page_view cost_per_ action_type_ landing_page _view 1.14
41 Metrics cost_per_ action_type _post_ engagement cost_per_ action_type _post_engagement 0.0304
42 Metrics cost_per_ action_type _page_engagement cost_per_ action_type _page_engagement 0.0304
43 Metrics cost_per_ action_type_ video_view cost_per_ action_type_ video_view 0.032806
44 Metrics cost_per_ad _click cost_per_ad _click
45 Metrics cost_per_ conversion cost_per_ conversion
46 Metrics cost_per_dda_ countby_convs cost_per_dda_ countby_convs
47 Metrics cost_per_inline _link_click The average cost of each inline link click. 0.414545
48 Metrics cost_per_inline_ post_engagement The average cost of each inline post engagement. 0.414545
49 Metrics cost_per_one_ thousand_ad_ impression cost_per_one_ thousand_ad_ impression
50 Metrics cost_per_ outbound_click The average cost for each outbound click. 0.414545
51 Metrics cost_per_ store_visit _action cost_per _store_visit_ action
52 Metrics cost_per_ thruplay The average cost for each ThruPlay. This metric is in development. 0.038
53 Metrics cost_per_ unique_action_ type The average cost of each unique action. This metric is estimated. [action_type: landing_page_view, value:1.14], [action_type:video_view, value:0.035077], [action_type:link_click, value:0.414545], [action_type:post _engagement, value:0.034286], [action_type:page _engagement, value:0.034286]
54 Metrics cost_per_unique_ action_type_link _click cost_per _unique_ action_type _link_click 0.414545
55 Metrics cost_per_unique_ action_type _video_view cost_per_unique_ action_type _video_view 0.035077
56 Metrics cost_per _unique_ action_type _post_engagement cost_per_unique_ action_type _post_engagement 0.034286
57 Metrics cost_per_unique_ action_type _page_engagement cost_per_unique_ action_type _page_engagement 0.034286
58 Metrics cost_per_ unique_action_ type_landing_ page_view cost_per _unique_action_type_ landing_page _view 1.14
59 Metrics cost_per _unique_click The average cost for each unique click (all). This metric is estimated. 0.414545
60 Metrics cost_per_ unique_inline_ link_click The average cost of each unique inline link click. This metric is estimated. 0.414545
61 Metrics cost_per_ unique_outbound _click The average cost for each unique outbound click. This metric is estimated. 0.414545
62 Metrics cpc The average cost for each click (all). 0.414545
63 Metrics cpm The average cost for 1,000 impressions. 8.39779
64 Metrics cpp The average cost to reach 1,000 people. This metric is estimated. 9.519833
65 Dimension created_time created_time 29-07-2020
66 Metrics ctr The percentage of times people saw your ad and performed a click (all).  2.025783
67 Dimension date_start The start date for your data. This is controlled by the date range you’ve selected for your reporting view.  2020-08-01
68 Dimension date_stop The end date for your data. This is controlled by the date range you’ve selected for your reporting view. 2020-08-01
69 Metrics dda_countby _convs dda_countby _convs
70 Metrics estimated_ad_ recall_rate_lower_ bound estimated_ad_ recall_rate_lower_ bound
71 Metrics estimated_ad_ recall_rate_upper_ bound estimated_ad_ recall_rate_upper_ bound
72 Metrics estimated_ad_ recallers_lower_ bound estimated_ad_ recallers_lower_ bound
73 Metrics estimated_ad_ recallers_upper_ bound estimated_ad_ recallers_upper_ bound
74 Metrics frequency The average number of times each person saw your ad. This metric is estimated. 1.133612
75 Metrics full_view_ impressions The number of Full Views on your Page’s posts as a result of your ad.
76 Metrics full_view_ reach The number of people who performed a Full View on your Page’s post as a result of your ad.
77 Dimension gender_targeting gender_targeting
78 Metrics impressions The number of times your ads were on screen. 543
79 Metrics inline_link_ click_ctr The percentage of time people saw your ads and performed an inline link click. 2.025783
80 Metrics inline_link_ clicks The number of clicks on links to select destinations or experiences, on or off Facebook-owned properties. Inline link clicks use a fixed 1-day-click attribution window. 11
81 Metrics inline_post_ engagement The total number of actions that people take involving your ads. Inline post engagements use a fixed 1-day-click attribution window. 11
82 Metrics instant_experience _clicks_to_open instant_experience _clicks_to_open
83 Metrics instant_experience _clicks_to_start instant_experience _clicks_to_start
84 Metrics instant_experience _outbound_clicks instant_experience _outbound_clicks
85 Metrics interactive_ component_tap interactive_ component_tap
86 Dimension labels labels
87 Dimension location location
88 Metrics mobile_app_ purchase_roas The total return on ad spend (ROAS) from mobile app purchases. This is based on the value that you assigned when you set up the app event.
89 Dimension objective The objective reflecting the goal you want to achieve with your advertising. It may be different from the selected objective of the campaign in some cases. LINK_CLICKS
90 Metrics outbound_clicks The number of clicks on links that take people off Facebook-owned properties. 11
91 Metrics outbound_clicks_ ctr The percentage of times people saw your ad and performed an outbound click. 2.025783
92 Metrics purchase_roas The total return on ad spend (ROAS) from purchases. This is based on information received from one or more of your connected Facebook Business Tools and attributed to your ads.
93 Metrics qualifying_question_ qualify_answer_rate qualifying_ question_qualify_ answer_rate
94 Metrics reach The number of people who saw your ads at least once. Reach is different from impressions, which may include multiple views of your ads by the same people. This metric is estimated. 479
95 Metrics social_spend The total amount you’ve spent so far for your ads showed with social information. (ex: Jane Doe likes this).
96 Metrics spend The estimated total amount of money you’ve spent on your campaign, ad set or ad during its schedule. This metric is estimated. 4.56
97 Metrics store_visit_ actions store_visit_ actions [action_type: store_visit, value:0]
98 Metrics unique_actions The number of people who took an action that was attributed to your ads. This metric is estimated. [action_type: landing_page_view, value:4],[action_ type:video_view, value:130], [action_type:link_click, value:11], [action_type:post_ engagement, value:133], [action_type:page_ engagement, value:133]
99 Metrics unique_actions_ link_click unique_actions _link_click 11
100 Metrics unique_actions_ landing_page_view unique_actions _landing_page_view 4
101 Metrics unique_actions_ post_engagement unique_actions_ post_engagement 133
102 Metrics unique_actions_ page_engagement unique_actions_ page_engagement 133
103 Metrics unique_actions_ video_view unique_actions_ video_view 130
104 Metrics unique_clicks The number of people who performed a click (all). This metric is estimated. 11
105 Metrics unique_ctr The percentage of people who saw your ad and performed a unique click (all). This metric is estimated. 2.296451
106 Metrics unique_inline_link_ click_ctr The percentage of times people saw your ad and performed a link click. Inline click-through rate uses a fixed 1-day-click attribution window. This metric is estimated. 2.296451
107 Metrics unique_inline_ link_clicks The number of people who performed an inline link click. This metric is estimated. 11
108 Metrics unique_link_ clicks_ctr The percentage of people who saw your ad and performed a link click. This metric is estimated. 2.296451
109 Metrics unique_outbound _clicks The number of people who performed an outbound click. This metric is estimated. 11
110 Metrics unique_outbound_ clicks_ctr The percentage of people who saw your ad and performed an outbound click. This metric is estimated. 2.296451
111 Metrics unique_video_view _15_sec unique_video_view _15_sec 111
112 Dimension updated_time updated_time 03-08-2020
113 Metrics video_15_sec_ watched_actions video_15_sec_ watched_actions 120
114 Metrics video_30_sec_ watched_actions The number of times your video played for at least 30 seconds,or for nearly its total length if it’s shorter than 30 seconds.For each impression of a video, we’ll count video views separately and exclude any time spent replaying the video. 117
115 Metrics video_avg_time_ watched_actions The average time a video was played, including any time spent replaying the video for a single impression. 2
116 Metrics video_continuous_2_ sec_watched_actions video_continuous_2_ sec_watched_actions
117 Metrics video_p100_ watched_actions The number of times your video was played at 100% of its length, including plays that skipped to this point. 116
118 Metrics video_p25_ watched_actions The number of times your video was played at 25% of its length, including plays that skipped to this point. 151
119 Metrics video_p50_ watched_actions The number of times your video was played at 50% of its length, including plays that skipped to this point. 129
120 Metrics video_p75_ watched_actions The number of times your video was played at 75% of its length, including plays that skipped to this point. 121
121 Metrics video_p95_ watched_actions The number of times your video was played at 95% of its length, including plays that skipped to this point. 118
122 Metrics video_play_ actions The number of times your video starts to play. This is counted for each impression of a video and excludes replays. This metric is in development. 398
123 Metrics video_play_ curve_actions A video-play based curve graph that illustrates the percentage of video plays that reached a given second. Entries 0 to 14 represent seconds 0 thru 14. Entries 15 to 17 represent second ranges [15 to 20), [20 to 25), and [25 to 30). Entries
18 to 20 represent second ranges [30 to 40), [40 to 50), and [50 to 60). Entry 21 represents plays over 60 seconds.
[100, 54, 39, 35, 34, 32, 31, 2, 2, 1, 1, 1, 1, 1, 1, 1, 1, 1, 0, 0, 0, 0]
124 Metrics video_play_ retention_0_to_15s_ actions video_play_ retention_0_to_ 15s_actions
125 Metrics video_play_ retention_20_to_ 60s_actions video_play_ retention_20_to_ 60s_actions
126 Metrics video_play_ retention_graph_ actions video_play_ retention_graph_ actions
127 Metrics video_time_ watched_actions video_time_ watched_actions
128 Metrics website_ctr The percentage of times people saw your ad and performed a link click. 2.025783
129 Metrics website_purchase _roas The total return on ad spend (ROAS) from website purchases. This is based on the value of all conversions recorded by the Facebook pixel on your website and attributed to your ads.
130 Metrics wish_bid wish_bid
131 Electrik.AI sha_id Hashed primary key 4d7a30ffb7e178 09271acabafbb50c269 4c14878f352013ca5b0c 997a777b454
132 Electrik.AI snapshot_dt Date on which the data is captured 2019-06-09
133 Electrik.AI etl_org Organization Id Electrik AI
134 Electrik.AI etl_project Project Id PR000333
135 Electrik.AI etl_create_utc_ dttm Record loaded/created Timestamp in UTC 27-10-2020 22:49
136 Electrik.AI etl_update_utc_ dttm Record Update Timestamp in UTC 27-10-2020 22:49
137 Electrik.AI etl_start_utc_dttm EAI Flow Start Timestamp in UTC 27-10-2020 22:28
138 Electrik.AI etl_flow_nm EAI Flow Code AD_INSIGHT
139 Electrik.AI etl_flow_ instance_id EAI Flow Execution Instance Id FL00AD-201909101 44445424196

The Ad Insights report includes all statistics aggregated at the ad level.

Index Category Electrik.AI Column Name Description Sample Value
1 Dimension account_currency Currency that is used by your ad account. USD
2 Dimension account_id The ID number of your ad account, which groups your advertising activity. Your ad account includes your campaigns, ads and billing. 1207858389393050
3 Dimension account_name The name of your ad account, which groups your advertising activity. Your ad account includes your campaigns, ads and billing. Electrik.AI
4 Metrics action_values The total value of all conversions attributed to your ads.
5 Metrics actions The total number of actions people took that are attributed to your ads. Actions may include engagement, clicks or conversions. [action_type: video_view, value:139], [action_type: link_click, value:11], [action_type: landing_page _view, value:4] ,[action_ type:post_ engagement, value:150], [action_ type:page_ engagement, value:150]
6 Metrics actions_link_ click actions_ link_click 11
7 Metrics actions_ post_engagement actions_ post_engagement 150
8 Metrics actions_ page_engagement actions_ page_engagement 150
9 Metrics actions_ video_view actions_ video_view 139
10 Metrics actions_ landing_page_view actions_ landing_page_view 4
11 Metrics ad_click_ actions ad_click_ actions
12 Dimension ad_id The unique ID of the ad you’re viewing in reporting.
13 Metrics ad_impression_ actions ad_impression_ actions
14 Dimension ad_name The name of the ad you’re viewing in reporting.
15 Dimension adset_id The unique ID of the ad set you’ re viewing in reporting. An ad set is a group of ads that share the same budget, schedule, delivery optimization and targeting. 23845273720 500700
16 Dimension adset_name The name of the ad set you’re viewing in reporting. An ad set is a group of ads that share the same budget, schedule, delivery optimization and targeting. GA Interest Audience
17 Dimension age_targeting age_targeting
18 Dimension buying_type The method by which you pay for and target ads in your campaigns: through dynamic auction bidding, fixed-price bidding, or reach and frequency buying. This field is currently only visible at the campaign level. AUCTION
19 Dimension campaign_id The unique ID number of the ad campaign you’re viewing in reporting. Your campaign contains ad sets and ads. 2384527372 0480700
20 Dimension campaign_name The name of the ad campaign you’re viewing in reporting. Your campaign contains ad sets and ads. Evergreen_EAI_ BrandAwareness
21 Metrics canvas_avg_ view_percent The average percentage of the Instant Experience that people saw. An Instant Experience is a screen that opens after someone interacts with your ad on a mobile device. It may include a series of interactive or multimedia components, including
video, images product catalog and more.
22 Metrics canvas_avg_ view_time The average total time, in seconds, that people spent viewing an Instant Experience. An Instant Experience is a screen that opens after someone interacts with your ad on a mobile device. It may include a series of interactive or multimedia
components, including video, images product catalog and more.
23 Metrics catalog_ segment_actions The number of actions performed attributed to your ads promoting your catalog segment, broken down by action type.
24 Metrics catalog_ segment_value The total value of all conversions from your catalog segment attributed to your ads.
25 Metrics catalog_segment_ value_mobile_ purchase_roas The total return on ad spend  (ROAS) from mobile app purchases for your catalog segment.
26 Metrics catalog_ segment_value _omni_purchase _roas The total return on ad  spend (ROAS) from all purchases for your catalog segment.
27 Metrics catalog_segment _value_website_ purchase_roas The total return on ad  spend (ROAS) from website purchases for your catalog segment.
28 Metrics clicks The number of clicks on your ads. 11
29 Metrics conversion_ values conversion_ values
30 Metrics conversions conversions
31 Metrics converted_ product_quantity The number of products purchased which are recorded by your merchant partner’s pixel or app SDK for a given product ID and driven by your ads. Has to be used together with converted product ID breakdown.
32 Metrics converted_product_ value The value of purchases recorded by your merchant partner’s pixel or app SDK for a given product ID and driven by your ads. Has to be used together with converted product ID breakdown.
33 Metrics cost_per_15 _sec_video_view cost_per_15 _sec_video_view 0.038
34 Metrics cost_per_2_sec_ continuous_video_ view cost_per _2_sec_continuous _video_view
35 Metrics cost_per_ action_type The average cost of a relevant action. [action_type: video_view, value: 0.032806],[action_ type:link_click, value:0.414545], [action_type: landing_page_ view, value: 1.14],[action_ type:post_ engagement, value:0.0304], [action_type: page_engagement, value:0.0304]
36 Metrics cost_per_ action_type_ link_click cost_per_ action_type_link _click 0.414545
37 Metrics cost_per_ action_type _landing_page _view cost_per _action_type _landing_page _view 1.14
38 Metrics cost_per _action_type_ post_engagement cost_per_ action_type_ post_engagement 0.0304
39 Metrics cost_per _action_type_ page_engagement cost_per_ action_type_page_ engagement 0.0304
40 Metrics cost_per_action_ type_video_view cost_per_action_ type_video_view 0.032806
41 Metrics cost_per_ad_ click cost_per_ad_ click
42 Metrics cost_per_ conversion cost_per_ conversion
43 Metrics cost_per_dda_ countby_convs cost_per_dda_ countby_convs
44 Metrics cost_per_inline_ link_click The average cost of each inline link click. 0.414545
45 Metrics cost_per_inline_ post_engagement The average cost of each inline post engagement. 0.414545
46 Metrics cost_per_one_ thousand_ad_ impression cost_per_one_ thousand_ad_ impression
47 Metrics cost_per_outbound _click The average cost for each outbound click. 0.414545
48 Metrics cost_per_store_ visit_action cost_per_store_ visit_action
49 Metrics cost_per_ thruplay The average cost for each ThruPlay. This metric is in development. 0.038
50 Metrics cost_per_unique_ action_type The average cost of each unique action. This metric is estimated. [action_ type:video_view, value:0.035077] ,[action_type: link_click, value:0.414545], [action_type: landing_page_view, value:1.14], [action_type:post_ engagement, value:0.034286], [action_type: page_engagement, value:0.034286]
51 Metrics cost_per_unique_ action_type_ link_click cost_per _unique_ action_type_ link_click 0.414545
52 Metrics cost_per _unique_ action_type_ landing _page_view cost_per_ unique_action_ type_video_view 1.14
53 Metrics cost_per_unique_ action_type_ video_view cost_ per_unique_ action_type_ post_engagement 0.035077
54 Metrics cost_per _unique_action _type_post_ engagement cost_per _unique_action _type_page_ engagement 0.034286
55 Metrics cost_per_ unique_action_ type_page_ engagement cost_per_ unique_action_ type_landing _page_view 0.034286
56 Metrics cost_per_unique _click The average cost for each unique click (all). This metric is estimated. 0.414545
57 Metrics cost_per_ unique_inline_ link_click The average cost of each unique inline link click. This metric is estimated. 0.414545
58 Metrics cost_per_ unique_outbound_ click The average cost for each unique outbound click. This metric is estimated. 0.414545
59 Metrics cpc The average cost for each click (all). 0.414545
60 Metrics cpm The average cost for 1,000 impressions. 8.39779
61 Metrics cpp The average cost to reach 1,000 people. This metric is estimated. 9.519833
62 Dimension created_time created_time 29-07-2020
63 Metrics ctr The percentage of times people saw your ad and performed a click (all). 2.025783
64 Dimension date_start The start date for your data. This is controlled by the date range you’ve selected for your reporting view. 01-08-2020
65 Dimension date_stop The end date for your data. This is controlled by the date range you’ve selected for your reporting view. 01-08-2020
66 Metrics dda_countby _convs dda_countby _convs
67 Metrics estimated_ad _recall_rate_lower _bound estimated _ad_recall _rate_lower _bound
68 Metrics estimated_ad_recall_ rate_upper_bound estimated_ad_recall_ rate_upper_bound
69 Metrics estimated_ad_ recallers_lower_bound estimated_ad_ recallers_lower_bound
70 Metrics estimated_ad_ recallers_upper_bound estimated_ad_ recallers_upper_bound
71 Metrics frequency The average number of times each person saw your ad. This metric is estimated. 1.133612
72 Metrics full_view_ impressions The number of Full Views on your Page’s posts as a result of your ad.
73 Metrics full_view_reach The number of people who performed a Full View on your Page’s post as a result of your ad.
74 Dimension gender_targeting gender_targeting
75 Metrics impressions The number of times your ads were on screen. 543
76 Metrics inline_link_ click_ctr The percentage of time people saw your ads and performed an inline link click. 2.025783
77 Metrics inline_link _clicks The number of clicks on links to select destinations or experiences, on or off Facebook-owned properties. Inline link clicks use a fixed 1-day-click attribution window. 11
78 Metrics inline_post_ engagement The total number of actions that people take involving your ads. Inline post engagements use a fixed 1-day-click attribution window. 11
79 Metrics instant_experience _clicks_to_open instant_experience _clicks_to_open
80 Metrics instant_experience _clicks_to_start instant_experience _clicks_to_start
81 Metrics instant_experience _outbound_clicks instant_experience _outbound_clicks
82 Metrics interactive_ component_tap interactive_ component_tap
83 Dimension labels labels
84 Dimension location location
85 Metrics mobile_app_ purchase_roas The total return on ad spend (ROAS) from mobile app purchases. This is based on the value that you assigned when you set up the app event.
86 Dimension objective The objective reflecting the goal you want to achieve with your advertising. It may be different from the selected objective of the campaign in some cases. LINK_CLICKS
87 Metrics outbound_clicks The number of clicks on links that take people off Facebook-owned properties. 11
88 Metrics outbound_clicks _ctr The percentage of times people saw your ad and performed an outbound click. 2.025783
89 Metrics purchase_roas The total return on ad spend  (ROAS) from purchases. This is based on information received from one or more of your connected Facebook Business Tools and attributed to your ads.
90 Metrics qualifying_question _qualify_answer_rate qualifying_question _qualify_answer_rate
91 Metrics reach The number of people who saw your ads at least once. Reach is different from impressions, which may include multiple views of your ads by the same people. This metric is estimated. 479
92 Metrics social_spend The total amount you’ve spent so far for your ads showed with social information. (ex: Jane Doe likes this). 0
93 Metrics spend The estimated total amount of money you’ve spent on your campaign, ad set or ad during its schedule. This metric is estimated. 4.56
94 Metrics store_visit_ actions store_visit_ actions [action_type: store_visit, value:0]
95 Metrics unique_actions The number of people who took an action that was attributed to your ads. This metric is estimated. [action_type: video_view, value: 130],[action_type: link_click, value: 11],[action_type: landing_page_view, value:4],[action_ type:post_engagement, value:133],[action_ type:page_engagement, value:133]
96 Metrics unique_actions_ link_click unique_actions_ link_click 11
97 Metrics unique_actions_ landing_page_view unique_actions_ landing_page_view 4
98 Metrics unique_actions_ post_engagement unique_actions_ post_engagement 133
99 Metrics unique_actions_ page_engagement unique_actions_ page_engagement 133
100 Metrics unique_actions_ video_view unique_actions_ video_view 130
101 Metrics unique_clicks The number of people who performed a click (all). This metric is estimated. 11
102 Metrics unique_ctr The percentage of people who saw your ad and performed a unique click (all). This metric is estimated. 2.296451
103 Metrics unique_inline_ link_click_ctr The percentage of times people saw your ad and performed a link click. Inline click-through rate uses a fixed 1-day -click attribution window. This metric is estimated. 2.296451
104 Metrics unique_inline_ link_clicks The number of people who performed an inline link click. This metric is estimated. 11
105 Metrics unique_link_clicks _ctr The percentage of people who saw your ad and performed a link click. This metric is estimated. 2.296451
106 Metrics unique_outbound_ clicks The number of people who performed an outbound click. This metric is estimated. 11
107 Metrics unique_outbound _clicks_ctr The percentage of people who saw your ad and performed an outbound click. This metric is estimated. 2.296451
108 Metrics unique_video_ view_15_sec unique_video_ view_15_sec 111
109 Metrics updated_time updated_time 03-08-2020
110 Metrics video_15_sec_ watched_actions video_15_sec_ watched_actions 120
111 Metrics video_30_sec_ watched_actions The number of times your video played for at least 30 seconds, or for nearly its total length if it’s shorter than 30 seconds. For each impression of a video, we’ll count video views separately and exclude any time spent replaying the video. 117
112 Metrics video_avg_time_ watched_actions The average time a video was played, including any time spent replaying the video for a single impression. 2
113 Metrics video_continuous_2 _sec_watched_actions video_continuous_2_ sec_watched_actions
114 Metrics video_p100_ watched_actions The number of times your video was played at 100% of its length, including plays that skipped to this point. 116
115 Metrics video_p25_ watched_actions The number of times your video was played at 25% of its length, including plays that skipped to this point. 151
116 Metrics video_p50_ watched_actions The number of times your video was played at 50% of its length, including plays that skipped to this point. 129
117 Metrics video_p75_ watched_actions The number of times your video was played at 75% of its length, including plays that skipped to this point. 121
118 Metrics video_p95_ watched_actions The number of times your video was played at 95% of its length, including plays that skipped to this point. 118
119 Metrics video_play_actions The number of times your video starts to play. This is counted for each impression of a video, and excludes replays. This metric is in development. 398
120 Metrics video_play_ curve_actions A video-play based curve graph that illustrates the percentage of video plays that reached a given second. Entries 0 to 14 represent seconds 0 thru 14. Entries 15 to 17 represent second ranges [15 to 20), [20 to 25), and [25 to 30). Entries
18 to 20 represent second ranges [30 to 40), [40 to 50), and [50 to 60). Entry 21 represents plays over 60 seconds.
121 Metrics video_play_retention _0_to_15s_actions video_play_retention _0_to_15s_actions
122 Metrics video_play_retention _20_to_60s_actions video_play_retention _20_to_60s_actions
123 Metrics video_play_retention_ graph_actions video_play_retention_ graph_actions
124 Metrics video_time_ watched_actions video_time_ watched_actions
125 Metrics website_ctr The percentage of times people saw your ad and performed a link click. 2.025783
126 Metrics website_purchase_roas The total return on ad  spend (ROAS) from website purchases. This is based on the value of all conversions recorded by the Facebook pixel on your website and attributed to your ads.
127 Electrik.AI sha_id Hashed primary key 4d7a30ffb7e17809271 acabafbb50c2694c14878f35 2013ca5b0c997a777b454
128 Electrik.AI snapshot_dt Date on which the data is captured 2019-06-09
129 Electrik.AI etl_org Organization Id Electrik AI
130 Electrik.AI etl_project Project Id PR000333
131 Electrik.AI etl_create_utc_dttm Record loaded/created Timestamp in UTC 27-10-2020 22:49
132 Electrik.AI etl_update_utc_dttm Record Update Timestamp in UTC 27-10-2020 22:49
133 Electrik.AI etl_start_ utc_dttm EAI Flow Start Timestamp in UTC 27-10-2020 22:28
134 Electrik.AI etl_flow_nm EAI Flow Code ADSET_ INSIGHT
135 Electrik.AI etl_flow_ instance_id EAI Flow Execution Instance Id FL00AD-20190 910144445424196

The Ad Insights report includes all statistics aggregated at the ad level.

Index Category Electrik.AI Column Name Description Sample Value
1 Dimension account_currency Currency that is used by your ad account. USD
2 Dimension account_id The ID number of your ad account, which groups your advertising activity. Your ad account includes your campaigns, ads and billing. 120785838 9393050
3 Dimension account_name The name of your ad account, which groups your advertising activity. Your ad account includes your campaigns, ads and billing. Electrik.AI
4 Metrics action_values The total value of all conversions attributed to your ads.
5 Metrics actions The total number of actions people took that are attributed to your ads. Actions may include engagement, clicks or conversions. [action_type: video_view, value:139], [action_type: link_click, value:11], [action_type: landing_page _view, value:4], [action_type:post_ engagement, value:150], [action_ type:page_ engagement, value:150]
6 Metrics actions_link _click actions_ link_click 11
7 Metrics actions_landing _page_view actions_landing _page_view 4
8 Metrics actions_post_ engagement actions_post_ engagement 150
9 Metrics actions_page_ engagement actions_page_ engagement 150
10 Metrics actions_video _view actions_video _view 139
11 Metrics ad_click_ actions ad_click_ actions
12 Dimension ad_id The unique ID of the ad you’re viewing in reporting.
13 Metrics ad_impression_ actions ad_impression_ actions
14 Dimension ad_name The name of the ad you’re viewing in reporting.
15 Dimension adset_id The unique ID of the ad set you’re viewing in reporting. An ad set is a group of ads that share the same budget, schedule, delivery optimization and targeting.
16 Dimension adset_name The name of the ad set you’re viewing in reporting. An ad set is a group of ads that share the same budget, schedule, delivery optimization and targeting.
17 Dimension age_targeting age_targeting
18 Metrics auction_bid auction_bid 0
19 Metrics auction_ competitiveness auction_ competitiveness 0
20 Metrics auction_max_ competitor_bid auction_max_ competitor_bid 0
21 Dimension buying_type The method by which you pay for and target ads in your campaigns: through dynamic auction bidding, fixed-price bidding, or reach and frequency buying. This field is currently only visible at the campaign level. AUCTION
22 Dimension campaign_id The unique ID number of the ad campaign you’re viewing in reporting. Your campaign contains ad sets and ads. 238452737 20480700
23 Dimension campaign_name The name of the ad campaign you’re viewing in reporting. Your campaign contains ad sets and ads. Evergreen_EAI _BrandAwareness
24 Metrics canvas_avg_ view_percent The average percentage of the Instant Experience that people saw. An Instant Experience is a screen that opens after someone interacts with your ad on a mobile device. It may include a series of interactive or multimedia components, including
video, images product catalog and more.
25 Metrics canvas_avg_ view_time The average total time, in seconds, that people spent viewing an Instant Experience. An Instant Experience is a screen that opens after someone interacts with your ad on a mobile device. It may include a series of interactive or multimedia
components, including video, images product catalog and more.
26 Metrics catalog_segment _actions The number of actions performed attributed to your ads promoting your catalog segment, broken down by action type.
27 Metrics catalog_segment _value The total value of all conversions from your catalog segment attributed to your ads.
28 Metrics catalog_segment _value_mobile_ purchase_roas The total return on ad spend (ROAS) from mobile app purchases for your catalog segment.
29 Metrics catalog_segment_ value_omni_purchase _roas The total return on ad spend  (ROAS) from all purchases for your catalog segment.
30 Metrics catalog_segment _value_website _purchase_roas The total return on ad  spend (ROAS) from website purchases for your catalog segment.
31 Metrics clicks The number of clicks on your ads. 11
32 Metrics conversion_ values conversion_ values
33 Metrics conversions conversions
34 Metrics converted_product _quantity The number of products purchased which are recorded by your merchant partner’s pixel or app SDK for a given product ID and driven by your ads. Has to be used together with converted product ID breakdown.
35 Metrics converted_ product_value The value of purchases recorded by your merchant partner’s pixel or app SDK for a given product ID and driven by your ads. Has to be used together with converted product ID breakdown.
36 Metrics cost_per_15 _sec_video_view cost_per_15_ sec_video_view 0.038
37 Metrics cost_per_2_sec_ continuous_video _view cost_per_2_sec_ continuous_video _view
38 Metrics cost_per_ action_type The average cost of a relevant action. [action_type: video_view, value:0.032806] ,[action_type :link_click, value:0.414545], [action_type: landing_page _view,value: 1.14],[action _type:post _engagement, value:0.0304], [action_type: page_engagement, value:0.0304]
39 Metrics cost_per_ action_type_ link_click cost_per_action _type_link_click 0.414545
40 Metrics cost_per_action _type_landing_page _view cost_per_action _type_landing_page _view 1.14
41 Metrics cost_per_action _type_post _engagement cost_per_action _type_post _engagement 0.0304
42 Metrics cost_per _action_type_ page_engagement cost_per_ action_type_ page_engagement 0.0304
43 Metrics cost_per _action_type_ video_view cost_per _action_type_ video_view 0.032806
44 Metrics cost_per_ ad_click cost_per_ ad_click
45 Metrics cost_per_ conversion cost_per_ conversion
46 Metrics cost_per_dda _countby_convs cost_per_dda _countby_convs
47 Metrics cost_per_inline _link_click The average cost of each inline link click. 0.414545
48 Metrics cost_per_inline _post_engagement The average cost of each inline post engagement. 0.414545
49 Metrics cost_per_one_ thousand_ad_ impression cost_per_one_ thousand_ad_ impression
50 Metrics cost_per_ outbound_click The average cost for each outbound click. 0.414545
51 Metrics cost_per_ store_visit_ action cost_per_ store_visit_ action
52 Metrics cost_per_ thruplay The average cost for each ThruPlay. This metric is in development. 0.038
53 Metrics cost_per_unique _action_type The average cost of each unique action. This metric is estimated. [action_type: video_view, value:0.035077], [action_type: link_click, value:0.414545], [action_type: landing_page _view, value: 1.14],[action _type:post_ engagement, value:0.034286], [action_type: page_engagement, value:0.034286]
54 Metrics cost_per_ unique_action_ type_link_click cost_per_ unique_action_ type_link_click 0.414545
55 Metrics cost_per_unique _action_type_ landing_page_view cost_per_unique _action_type_ video_view 1.14
56 Metrics cost_per_unique _action_type_video _view cost_per_ unique_action_ type_post_ engagement 0.035077
57 Metrics cost_per_ unique_action_ type_post_ engagement cost_per_ unique_action_ type_page_ engagement 0.034286
58 Metrics cost_per_unique _action_type_page _engagement cost_per_ unique_action_ type_landing_ page_view 0.034286
59 Metrics cost_per_ unique_click The average cost for each unique click (all). This metric is estimated. 0.414545
60 Metrics cost_per_ unique_inline_ link_click The average cost of each unique inline link click. This metric is estimated. 0.414545
61 Metrics cost_per_ unique_outbound_ click The average cost for each unique outbound click. This metric is estimated. 0.414545
62 Metrics cpc The average cost for each click (all). 00-01-1900
63 Metrics cpm The average cost for 1,000 impressions. 8.39779
64 Metrics cpp The average cost to reach 1,000 people. This metric is estimated. 09-01-1900
65 Metrics created_time created_time 29-07-2020
66 Metrics ctr The percentage of times people saw your ad and performed a click (all). 2.025783
67 Dimension date_start The start date for your data. This is controlled by the date range you’ve selected for your reporting view. 01-08-2020
68 Dimension date_stop The end date for your data. This is controlled by the date range you’ve selected for your reporting view. 01-08-2020
69 Metrics dda_countby_convs dda_countby_convs
70 Metrics estimated_ad_recall _rate_lower_bound estimated_ad_recall _rate_lower_bound
71 Metrics estimated_ad_recall _rate_upper_bound estimated_ad_recall _rate_upper_bound
72 Metrics estimated_ad_ recallers_lower_bound estimated_ad_ recallers_lower_bound
73 Metrics estimated_ad_ recallers_upper_bound estimated_ad_ recallers_upper_bound
74 Metrics frequency The average number of times each person saw your ad. This metric is estimated. 1.133612
75 Metrics full_view_ impressions The number of Full Views on your Page’s posts as a result of your ad.
76 Metrics full_view_reach The number of people who performed a Full View on your Page’s post as a result of your ad.
77 Metrics gender_targeting gender_targeting
78 Metrics impressions The number of times your ads were on screen. 543
79 Metrics inline_link_ click_ctr The percentage of time people saw your ads and performed an inline link click. 2.025783
80 Metrics inline_link_ clicks The number of clicks on links to select destinations or experiences, on or off Facebook- owned properties. Inline link clicks use a fixed 1-day-click attribution window. 11
81 Metrics inline_post_ engagement The total number of actions that people take involving your ads. Inline post engagements use a fixed 1-day-click attribution window. 11
82 Metrics instant_experience_ clicks_to_open instant_experience_ clicks_to_open
83 Metrics instant_experience_ clicks_to_start instant_experience_ clicks_to_start
84 Metrics instant_experience _outbound_clicks instant_experience _outbound_clicks
85 Metrics interactive_ component_tap interactive_ component_tap
86 Dimension labels labels
87 Dimension location location
88 Metrics mobile_app_ purchase_roas The total return on ad spend (ROAS) from mobile app purchases. This is based on the value that you assigned when you set up the app event.
89 Dimension objective The objective reflecting the goal you want to achieve with your advertising. It may be different from the selected objective of the campaign in some cases. LINK_CLICKS
90 Metrics outbound_clicks The number of clicks on links that take people off Facebook-owned properties. 11
91 Metrics outbound_clicks_ctr The percentage of times people saw your ad and performed an outbound click. 2.025783
92 Metrics purchase_roas The total return on ad spend (ROAS) from purchases. This is based on information received from one or more of your connected Facebook Business Tools and attributed to your ads.
93 Metrics qualifying_question _qualify_answer_rate qualifying_question _qualify_answer_rate
94 Metrics reach The number of people who saw your ads at least once. Reach is different from impressions, which may include multiple views of your ads by the same people. This metric is estimated. 479
95 Metrics social_spend The total amount you’ve spent so far for your ads showed with social information. (ex: Jane Doe likes this). 0
96 Metrics spend The estimated total amount of money you’ve spent on your campaign, ad set or ad during its schedule. This metric is estimated. 4.56
97 Metrics store_visit_ actions store_visit_ actions [action_type: store_visit, value:0]
98 Metrics unique_actions The number of people who took an action that was attributed to your ads. This metric is estimated. [action_type: video_view, value:130], [action_type: link_click, value:11], [action_type: landing_page _view, value:4], [action_type: post_engagement, value:133], [action_type: page_engagement, value:133]
99 Metrics unique_clicks The number of people who performed a click (all). This metric is estimated. 11
100 Metrics unique_actions_ link_click unique_actions_ link_click 11
101 Metrics unique_actions_ landing_page_view unique_actions_ landing_page_view 4
102 Metrics unique_actions_ post_engagement unique_actions_ post_engagement 133
103 Metrics unique_actions_ page_engagement unique_actions_ page_engagement 133
104 Metrics unique_actions_ video_view unique_actions_ video_view 130
105 Metrics unique_ctr The percentage of people who saw your ad and performed a unique click (all). This metric is estimated. 2.296451
106 Metrics unique_inline_ link_click_ctr The percentage of times people saw your ad and performed a link click. Inline click-through rate uses a fixed 1-day-click attribution window. This metric is estimated. 2.296451
107 Metrics unique_inline_ link_clicks The number of people who performed an inline link click. This metric is estimated. 11
108 Metrics unique_link_ clicks_ctr The percentage of people who saw your ad and performed a link click. This metric is estimated. 2.296451
109 Metrics unique_outbound _clicks The number of people who performed an outbound click. This metric is estimated. 11-01-1900
110 Metrics unique_outbound_ clicks_ctr The percentage of people who saw your ad and performed an outbound click. This metric is estimated. 2.296451
111 Metrics unique_video _view_15_sec unique_video _view_15_sec 111
112 Dimension updated_time updated_time 03-08-2020
113 Metrics video_15_sec_ watched_actions video_15_sec_ watched_actions 120
114 Metrics video_30_sec_ watched_actions The number of times your video played for at least 30 seconds, or for nearly its total length if it’s shorter than 30 seconds. For each impression of a video, we’ll count video views separately and exclude any time spent replaying the video. 117
115 Metrics video_avg_time_ watched_actions The average time a video was played, including any time spent replaying the video for a single impression. 2
116 Metrics video_continuous_ 2_sec_watched_actions video_continuous_ 2_sec_watched_actions
117 Metrics video_p100_ watched_actions The number of times your video was played at 100% of its length, including plays that skipped to this point. 116
118 Metrics video_p25_watched _actions The number of times your video was played at 25% of its length, including plays that skipped to this point. 151
119 Metrics video_p50_ watched_actions The number of times your video was played at 50% of its length, including plays that skipped to this point. 129
120 Metrics video_p75_ watched_actions The number of times your video was played at 75% of its length, including plays that skipped to this point. 121
121 Metrics video_p95_ watched_actions The number of times your video was played at 95% of its length, including plays that skipped to this point. 118
122 Metrics video_play_ actions The number of times your video starts to play. This is counted for each impression of a video and excludes replays. This metric is in development. 398
123 Metrics video_play_curve _actions A video-play based curve graph that illustrates the percentage of video plays that reached a given second. Entries 0 to 14 represent seconds 0 thru 14. Entries 15 to 17 represent second ranges [15 to 20), [20 to 25), and [25 to 30). Entries
18 to 20 represent second ranges [30 to 40), [40 to 50), and [50 to 60). Entry 21 represents plays over 60 seconds.
124 Metrics video_play_retention _0_to_15s_actions video_play_retention _0_to_15s_actions
125 Metrics video_play_retention_ 20_to_60s_actions video_play_retention_ 20_to_60s_actions
126 Metrics video_play_retention_ graph_actions video_play_retention_ graph_actions
127 Metrics video_time_ watched_actions video_time_ watched_actions
128 Metrics website_ctr The percentage of times people saw your ad and performed a link click. 1900-01-02
129 Metrics website_purchase _roas The total return on ad spend (ROAS) from website purchases. This is based on the value of all conversions recorded by the Facebook pixel on your website and attributed to your ads.
130 Metrics wish_bid wish_bid 0
131 Electrik.AI sha_id Hashed primary key 4d7a30ffb7e178 09271acabafbb50c2 694c14878f352013 ca5b0c997a777b454
132 Electrik.AI snapshot_dt Date on which the data is captured 43625
133 Electrik.AI etl_org Organization Id Electrik AI
134 Electrik.AI etl_project Project Id PR000333
135 Electrik.AI etl_create_utc_dttm Record loaded/created Timestamp in UTC 27-10-2020 22:49
136 Electrik.AI etl_update_utc_dttm Record Update Timestamp in UTC 27-10-2020 22:49
137 Electrik.AI etl_start_utc_dttm EAI Flow Start Timestamp in UTC 27-10-2020 22:28
138 Electrik.AI etl_flow_nm EAI Flow Code CAMPAIGN_ INSIGHT
139 Electrik.AI etl_flow_ instance_id EAI Flow Execution Instance Id FL00AD-20190 910144445424196